
Figure 5: Immune cell subpopulations in periodontal disease.
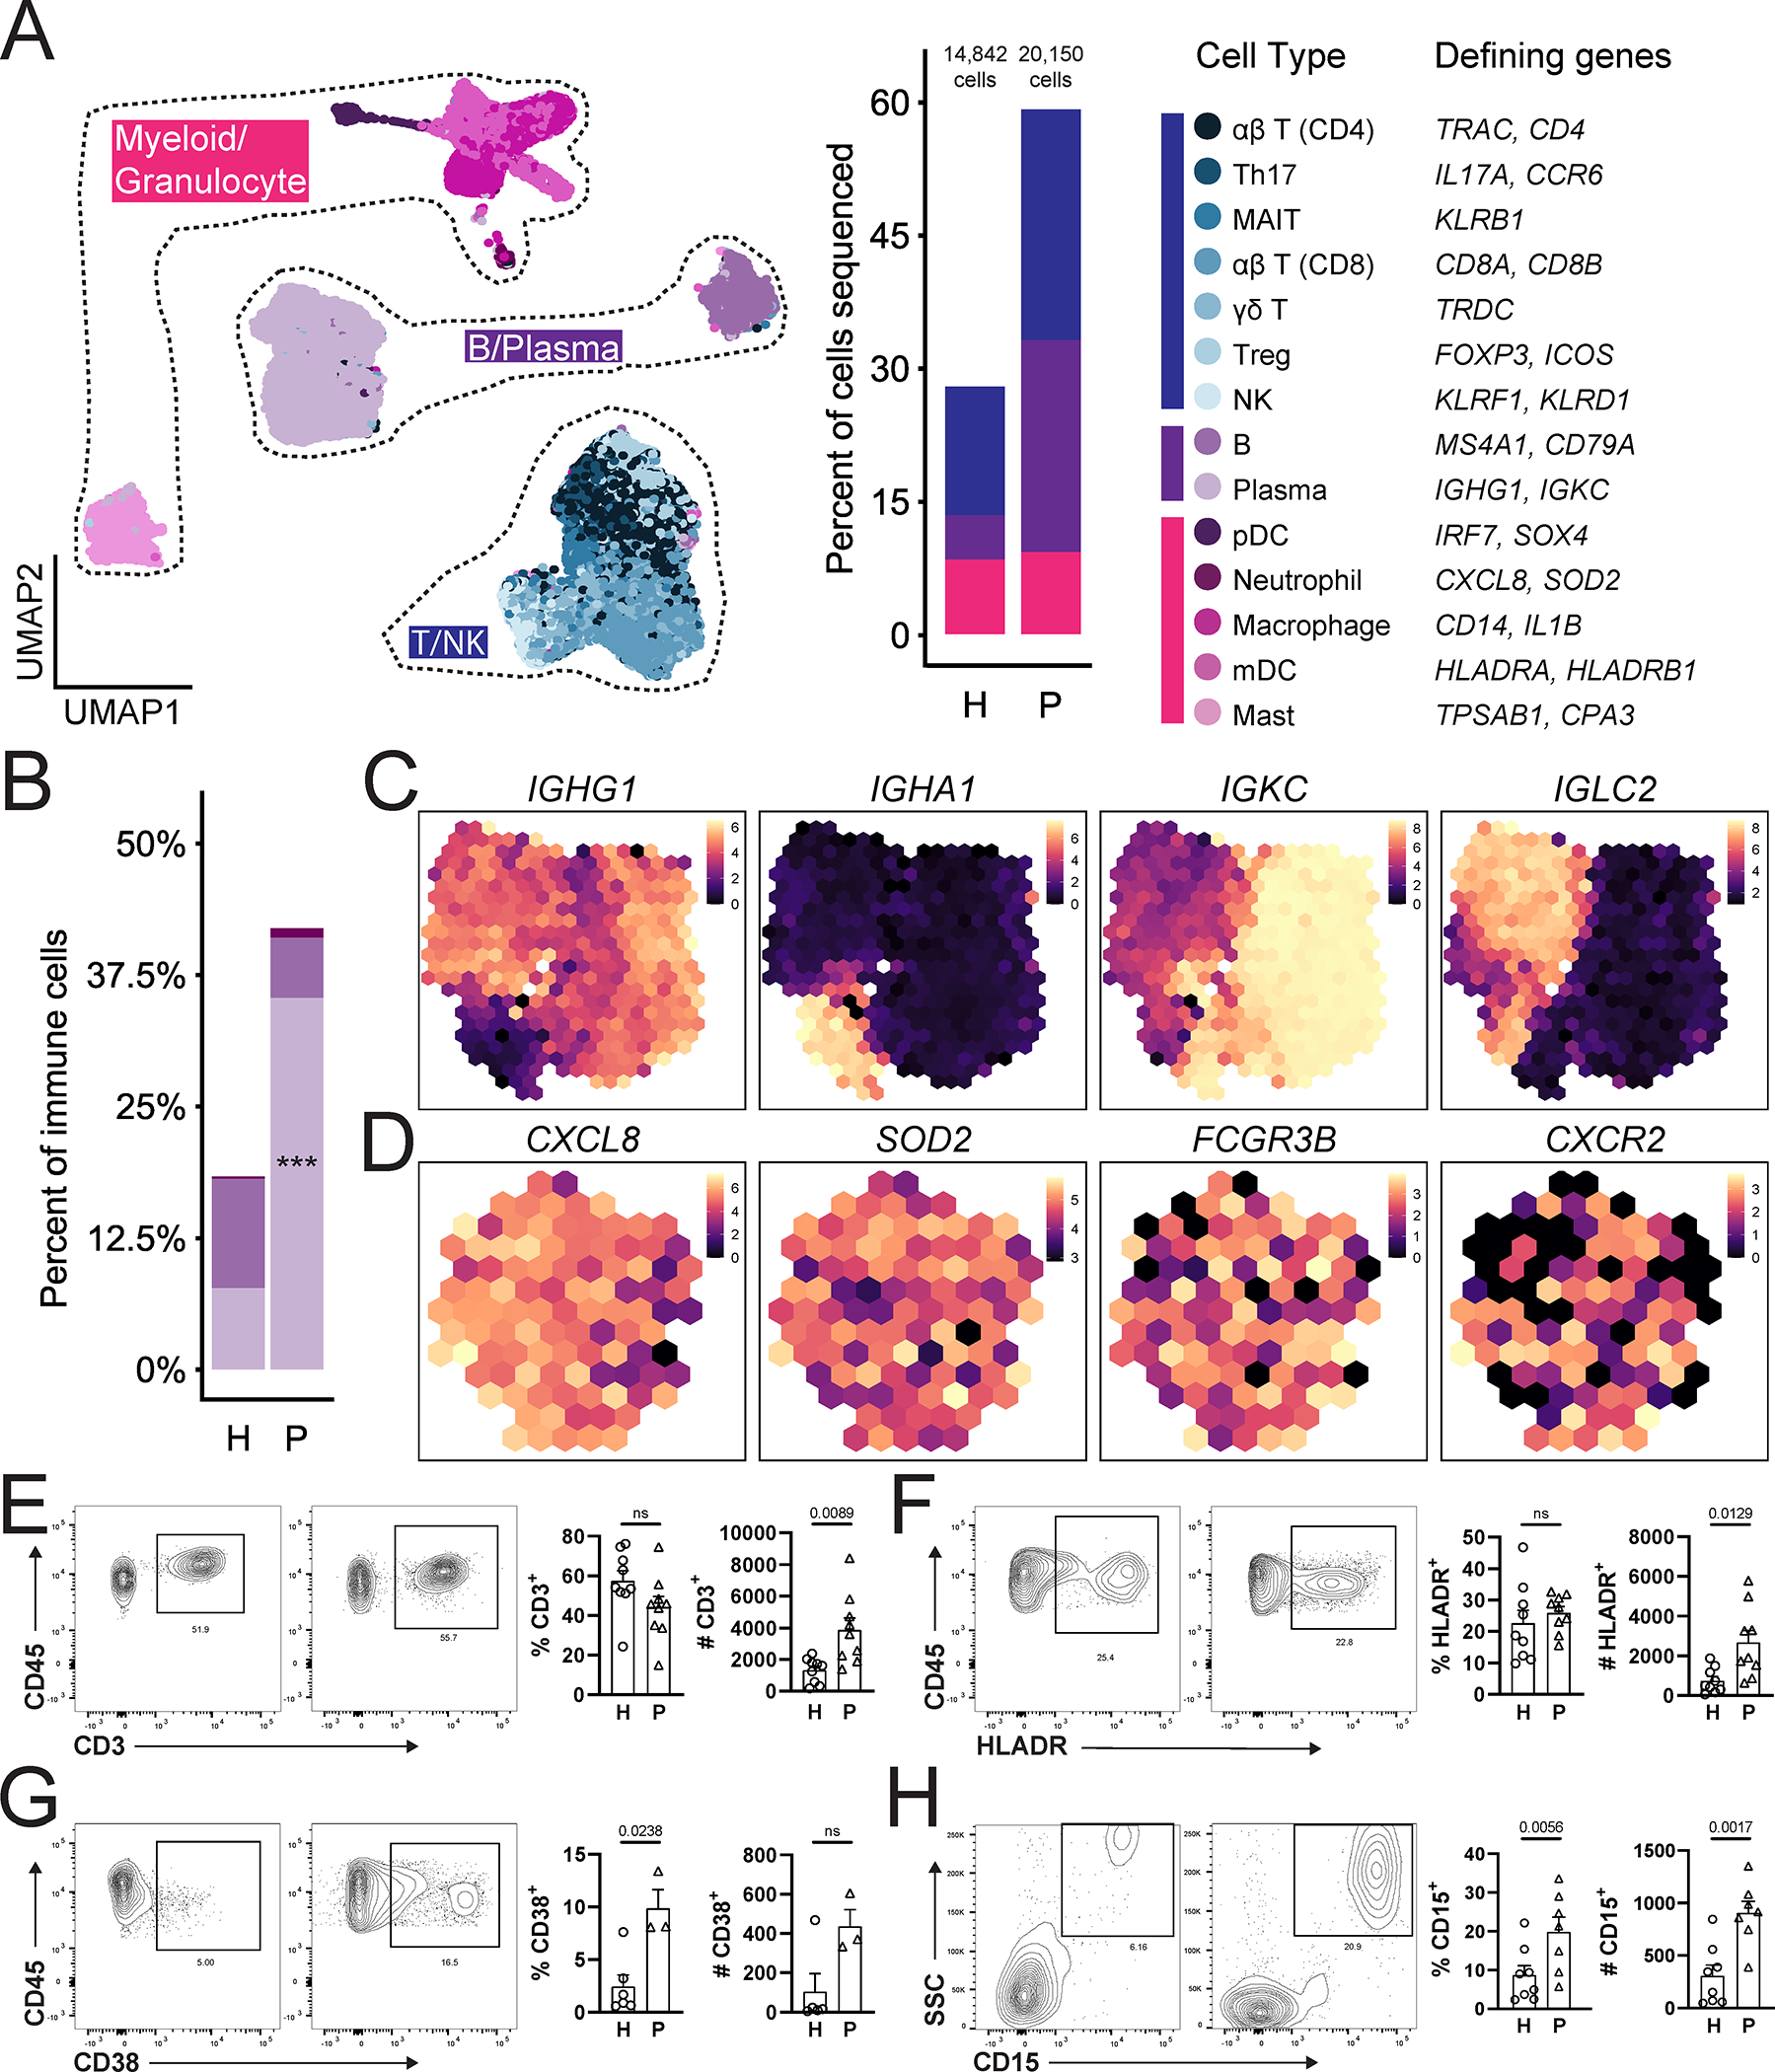
A. UMAP (left) showing immune cell subpopulations from both health (n=13) and disease (n=8) divided spatially into three main categories (T/NK, B/Plasma and Myeloid/Granulocyte). Proportion plot (middle). Colors indicate the cell type annotated using SingleR and manual annotation and validated by cell-type specific gene expression (right). B. Bar graph depicts proportion of B, plasma cells and neutrophils in health (H) and periodontitis (P). Refer to methods for statistical tests used. ***p<0.001. C,D. Normalized average expression of plasma cell- (C) and neutrophil- (D) specific markers visualized in low-dimensional space with schex. Each area containing cells on the UMAP was divided into hexagonal areas and gene expression values within each area were averaged across cells present. E-H. Representative flow cytometry scatter plots from an independent health and periodontitis cohort. Cells were gated from Single/Live cells and CD45/CD3 (E), CD45/HLADR (F), CD45/CD38 (G), CD45/CD15 (H). Bar graphs demonstrate % expression (one dot per individual, n=3–9/group). Refer to methods for statistical tests used. P values are indicated on each graph. See also Table S1, Figure S4, S5.