
Figure 6: Stromal cell populations and stromal- immune interactome in periodontitis.
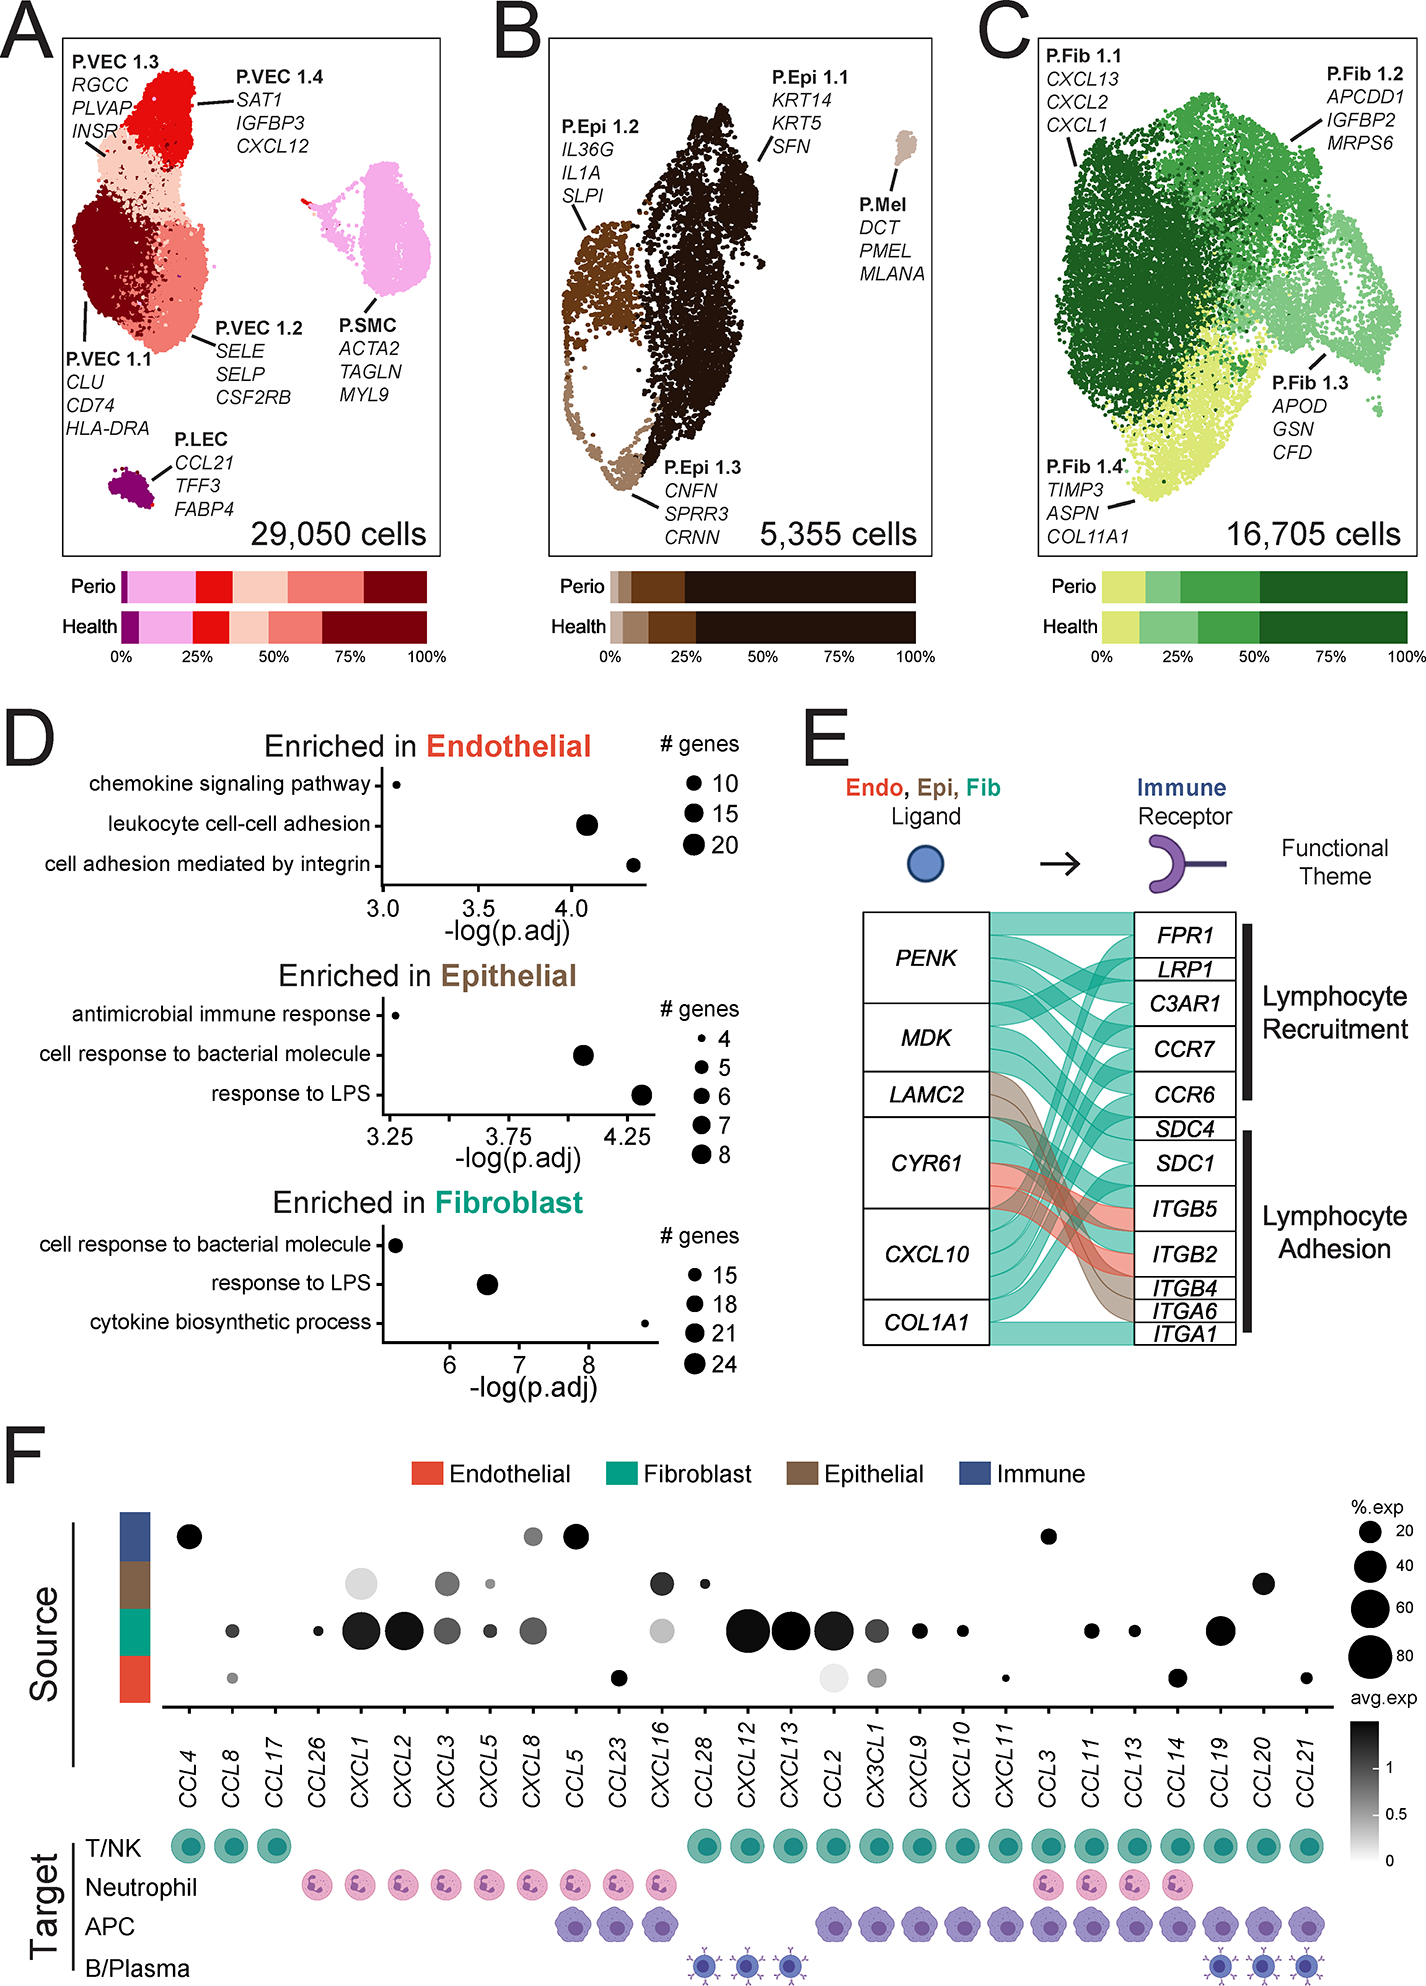
A-C. UMAP representation (top) and proportion plots (bottom) for endothelial (A; 29,050 cells), epithelial (B; 5,355 cells) and fibroblast (C; 16,705 cells) populations, respectively, in the combined health (n=13) and periodontitis (n=8) dataset. Gene labels indicate cluster-defining genes. Refer to methods for statistical tests used. D. Dot plots of pathways enriched in periodontal disease per major cell population. Some GO terms truncated for brevity, original terms and gene list in Table S6. The size of each dot represents the number of genes from each pathway. E. Alluvial plot showing selected ligand-receptor pairs significantly over-represented in periodontal disease determined by NicheNetR. For this analysis, only interactions of immune cells (receptors) with all other cell types, and only ligands and receptors that are differentially expressed (p<0.05), are considered. F. Chemokine/chemokine receptor interactions in health and periodontal disease. Dot plot indicating expression of chemokines in major cell types (top) and the immune cell(s) in the scRNA seq dataset that express cognate receptors (bottom). Expression values are normalized and scaled averages. Refer to Figure S6 for expression data of chemokine receptors. Clusters were generated using a resolution of 1 prior to sub-setting into major cell types and were not reclustered. See also Table S6, Figure S5, S6.