Figure 1.

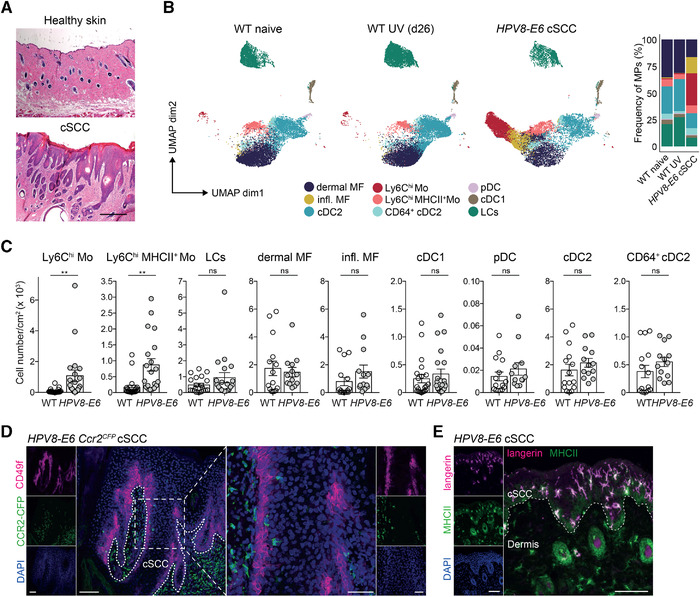
Ly6Chi monocytes accumulate in cSCC. (A) H&E staining of cSCC and healthy control skin of HPV8‐E6 mice. Scale bar: 200 μm. Representative images from three mice. (B and C) Flow cytometry analysis of mononuclear phagocytes in naïve skin of WT mice, UV‐treated skin of WT mice, or UV‐induced cSCC in HPV8‐E6 mice. (B) Uniform manifold approximation and projection (UMAP) plots and frequency of mononuclear phagocytes (MPs) (pregated on CD45+CD3−Siglec‐F−Ly6G−) (26 dpUV). Combined data from three to five mice in each group, shown is one representative of three independent experiments. Refers to Supporting Information Figure S1A. (C) Total number of Ly6Chi monocytes (Mo) (MHCII+ and MHCII−), LCs, dermal macrophages (MF), inflammatory (infl.) MF, cDC1s, plasmacytoid DCs (pDCs), cDC2s, and CD64+ cDC2s per cm2 of UV‐exposed WT skin (n = 15–21) or cSCC from HPV8‐E6 mice (n = 13–20). Representative gating strategy shown in Supporting Fig. S1B. Data pooled from three to five individual experiments. **p < 0.01, Student's t‐test, two‐tailed. (D) Immunohistochemistry of CFP (CCR2, green) and CD49f (keratinocytes, magenta) in cSCC on day 28 after UVR of HPV8‐E6 Ccr2CFP mice. Representative images from three mice. Dotted line marks the border of the cSCC. Scale bar left is 100 μm, scale bar in zoomed image is 50 μm. (E) Immunohistochemistry of langerin (magenta) and MHCII (green) in UV‐induced cSCC from HPV8‐E6 on day 42 after UVR, counterstained with DAPI (blue). Scale bar: 100 μm. Dotted line represents cSCC border. Representative image from three mice.
