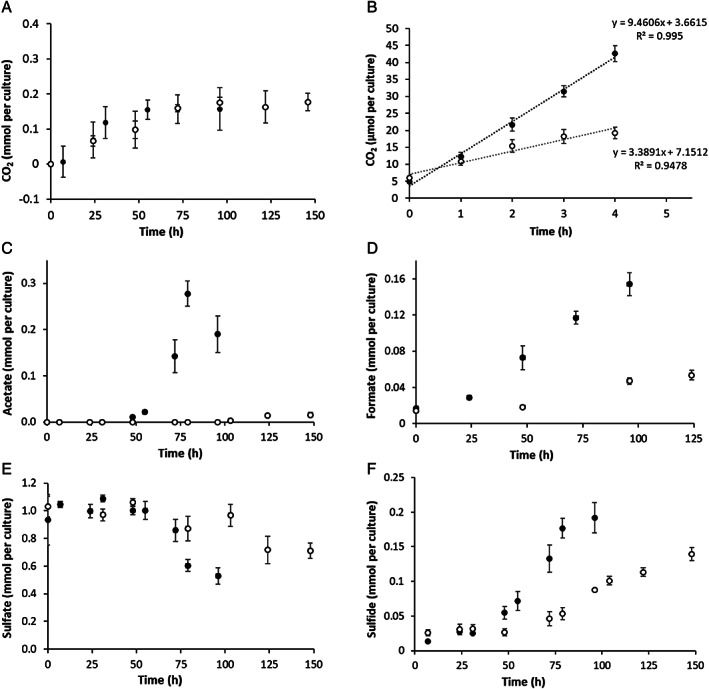
Fig 2.

Substrate consumption and product formation during growth of A. fulgidus on 12 mM 2‐methoxyphenol (grey circles) versus 34 mM lactate (black circles) with 16 mM sulfate as electron acceptor. Samples for (A), (C), (D), (E) and (F) were taken during the growth experiments shown in Fig. 1B and D. Samples for (B) were taken during a resting cell experiment. CO2 and acetate were measured by gas chromatography and formate, sulfate and sulfide with colorimetric assays. Data are presented as mean +/− standard deviation (n = 3).
