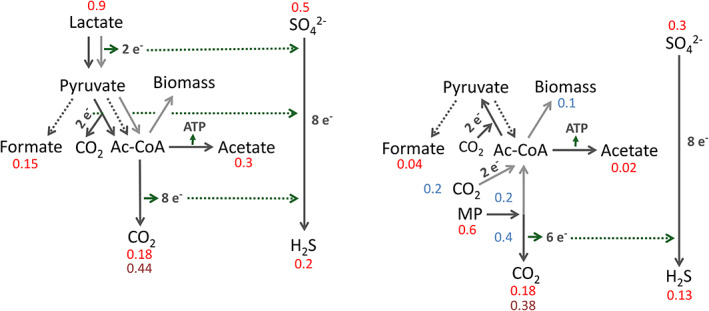
Fig 3.

Substrate consumption/product formation during growth of A. fulgidus on 12 mM 2‐methoxyphenol versus 34 mM lactate. Values refer to mmol per culture. Red values are based on experimental measurements (see Fig. 2; dark red values refer to resting cell experiment) and blue values are based on estimations (Compensation for the experimentally determined values for metabolites such as CO2 and MP). Dark green dotted arrows visualize electrons liberated during carbon metabolism that are consumed during sulfate reduction. Sulfide is most likely underestimated as sulfide reacts with other medium/cell components and is also used for assimilation. [Color figure can be viewed at wileyonlinelibrary.com]
