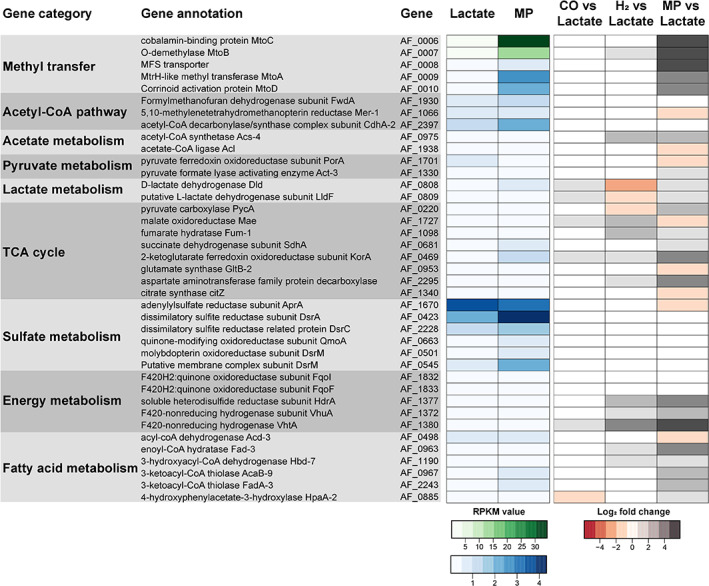
Fig 6.

Comparison of gene expression during growth of A. fulgidus on lactate to growth on 2‐methoxyphenol, H2/CO2 or CO. RPKM (reads per kilobase transcript per million mapped reads) values were normalized to the average S3 ribosomal protein (gene AF_1919) RPKM under growth on lactate or 2‐methoxyphenol (MP). RPKM values for AF_0006 and AF_0007 are depicted with a different scale (green shades) than the other genes (blue shades). Log2fold change values are shown for MP versus lactate (this study), H2/CO2 versus lactate (Hocking et al., 2014) and CO versus lactate (Hocking et al., 2015) (red/grey shades). Non‐normalized RPKM values and log2fold change values can also be found in Supporting Information Tables S1–S3. [Color figure can be viewed at wileyonlinelibrary.com]
