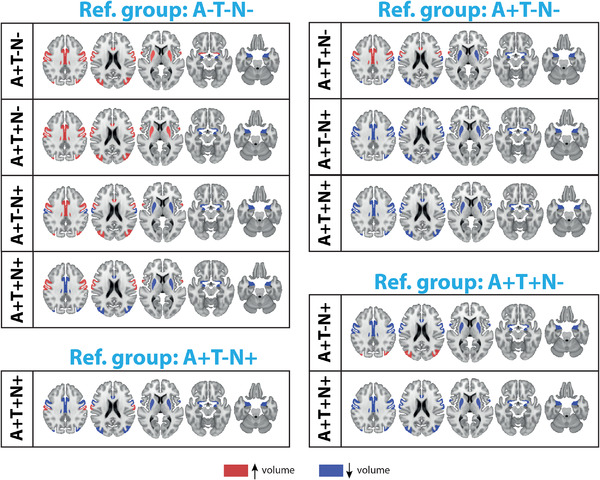
FIGURE 3.

Regional volumes able to distinguish between the different amyloid/tau/neurodegeneration (ATN) stages (P‐value < 0.05). The areas indicated in red show a higher volume, while those in blue show a lower volume compared to the reference (ref.) group. Reference group is indicated at the top of the image. The regression coefficients and P‐values are reported in Table 3
