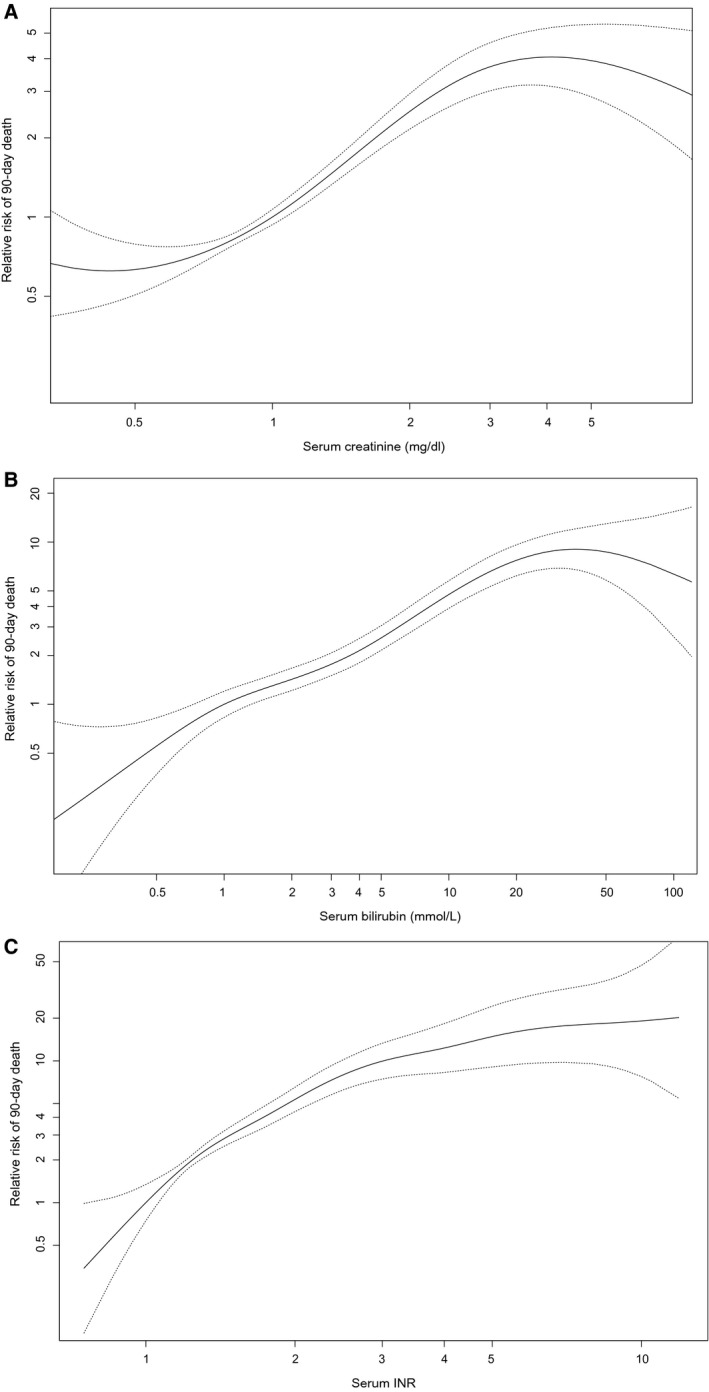
FIG. 1.

GAM with splines for creatinine, bilirubin, and INR based on the training data. Each line represents the relation of the studied parameter with 90‐day mortality, corrected for the other MELD parameters (creatinine is corrected for bilirubin and INR, and so on). (A) Relation between serum creatinine concentration and 90‐day mortality. (B) Relation between serum bilirubin concentration and 90‐day mortality. (C) Relation between serum INR and 90‐day mortality.
