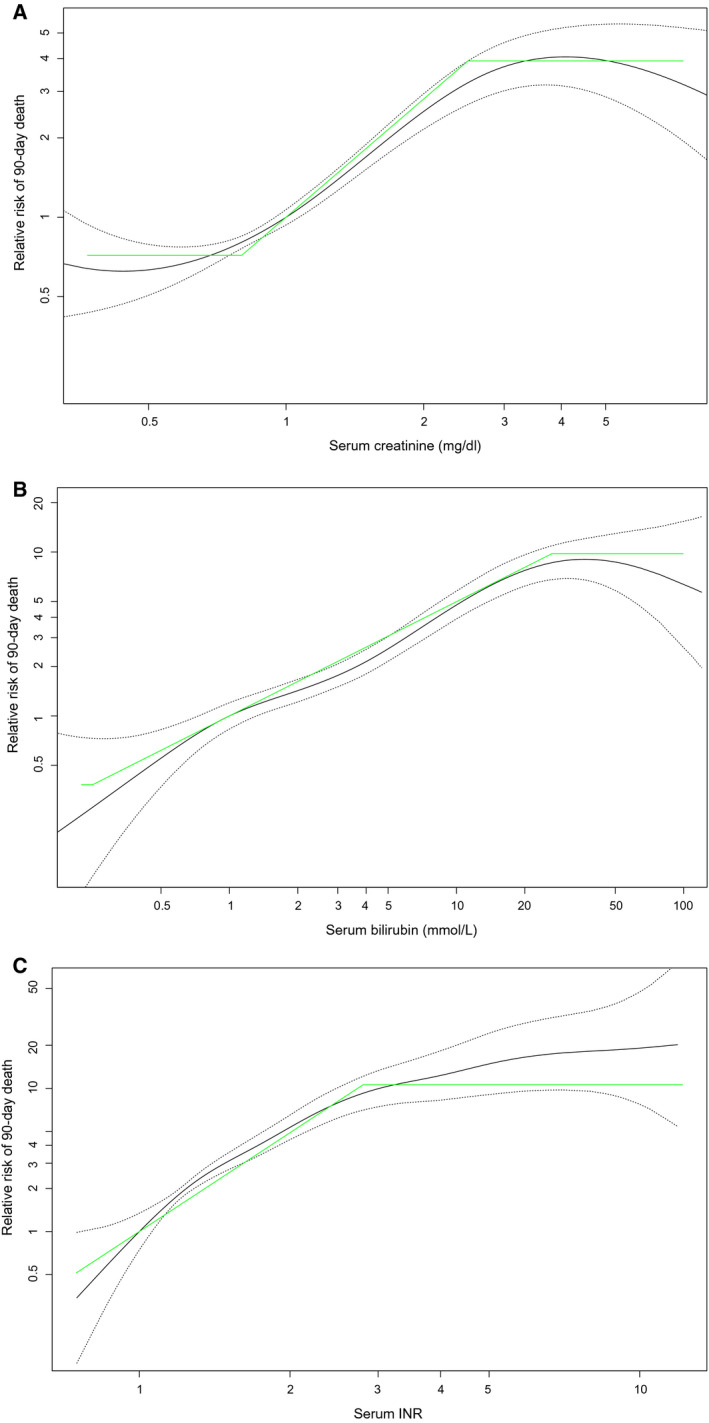
FIG. 2.

Over the GAM with splines, lines (green) were plotted that represent the coefficient (slope of the diagonal) and lower and upper boundaries (horizontal segments) of the refit parameters. (A) For creatinine, straight lines represent the coefficient (slope of the diagonal) and lower and upper boundaries (horizontal segments) in refit MELD. (B) For bilirubin, straight lines represent the coefficient (slope of the diagonal) and lower and upper boundaries (horizontal segments) in refit MELD. (C) For the INR, straight lines represent the coefficient (slope of the diagonal) and lower and upper boundaries (horizontal segments) in refit MELD.
