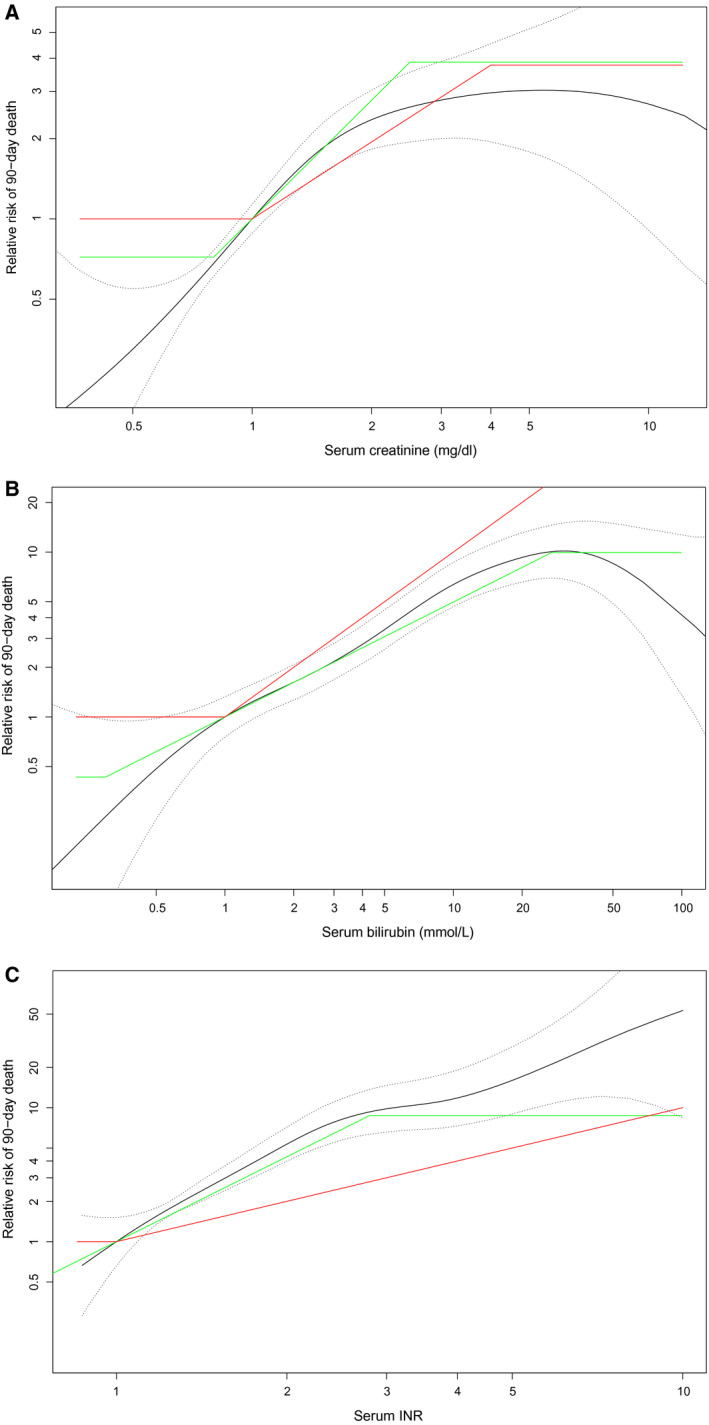
FIG. 3.

In the validation data, the GAM with splines for each parameter is shown. The coefficients and boundaries of reMELD (green) and UNOS‐MELD (red) were plotted. (A) In the validation data, the creatinine relation with 90‐day mortality is shown. The coefficients and boundaries of creatinine in reMELD (green) and UNOS‐MELD (red) were plotted to illustrate model fit. (B) In the validation data, the bilirubin relation with 90‐day mortality is shown. The coefficients and boundaries of bilirubin in reMELD (green) and UNOS‐MELD (red) were plotted to illustrate model fit. (C) In the validation data, the INR relation with 90‐day mortality is shown. The coefficients and boundaries of the INR in reMELD (green) and UNOS‐MELD (red) were plotted to illustrate model fit.
