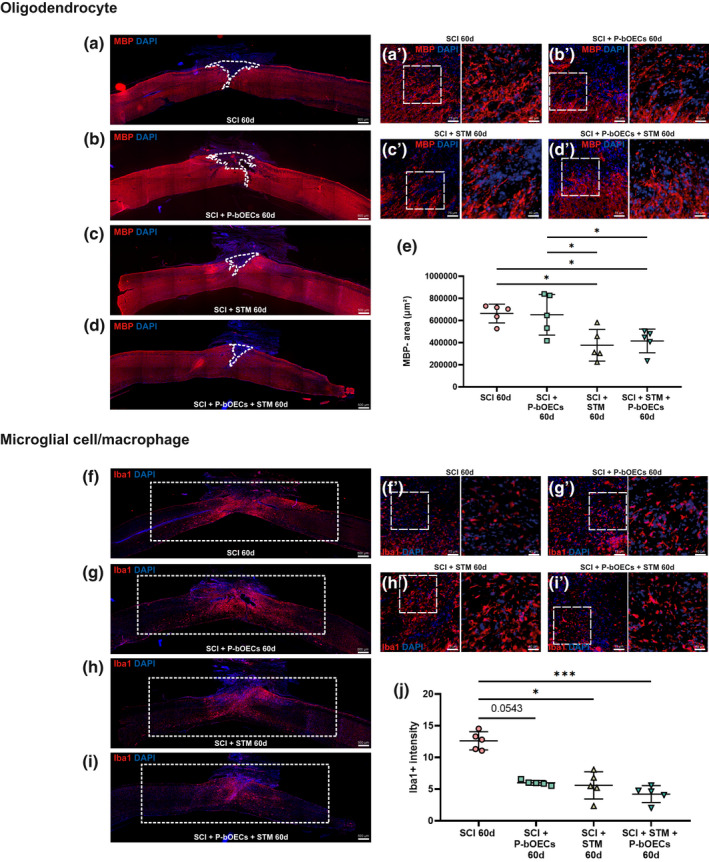
FIGURE 5.

Primary bOEC transplantation and rTSMS treatment decrease microglial cells activation but only rTSMS treatment decreases demyelination. Representative pictures of sagittal spinal cord sections 60 days after SCI (a, b, c, d, f, g, h, and I 50× magnification) and border of the spinal cord scar (a', b', c', d', f', g', h', and i 200× magnification). (a and f) SCI control, (b and g) SCI + primary bOECs, (c and h) SCI + STM, (d and i) SCI + primary bOECs + STM. Sections were stained with (a–d) anti‐MBP antibody, (f–j) anti‐Iba1 antibody and DAPI. Dotted lines show (a–d) demyelinated area (MBP‐). Rectangles show (f–i) Iba1 intensity areas measured. (e and j) Quantitative analysis of (e) MBP‐ area and (j) Iba1 intensity. Quantifications are expressed as average ± standard deviation. N = 5 per group. Statistical evaluations were based on Kruskal–Wallis test (*p < 0.05; **p < 0.01; ***p < 0.001)
