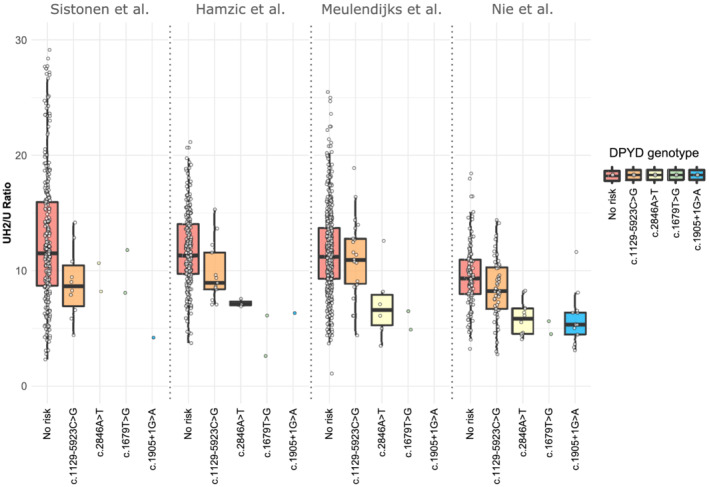
FIGURE 1.

Distribution of dihydrouracil/uracil (UH2/U) ratios according to DPYD risk genotype. Boxplots represent UH2/U ratios according to study cohorts and DPYD risk variant carriers in different colours. From left to right, the populations carrying: none of the 4 risk variants (red), c.1129‐5923G (orange), c.2846 T (yellow), c.1679G (green), and c.1905 + 1A (blue). All DPYD risk variant carriers were heterozygous for the mutation. The study from Meulendijks et al.21 excluded carriers of c.1905 + 1G > A in their study. The Nie et al.22 cohort was enriched for DPYD risk variant carriers (c.1129‐5923C > G, c.1679T > G, c.1905 + 1G > A, and c.2846A > T). Each variant was significantly associated with decreased ratios (Table 2). The boxes represent the first and third quartile, and the black bar represents the median. The whiskers represent 1.5× of the interquartile range
