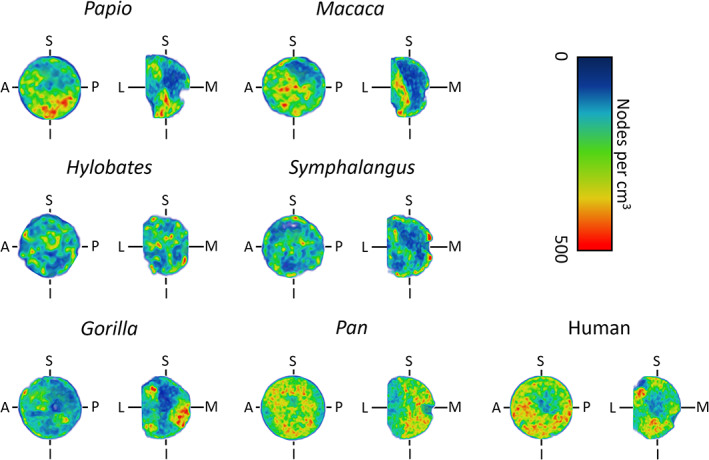
FIGURE 5.

Node density of the femoral head, measured using a kernel density approximation over a regular 3D grid. It is expressed as the number of nodes of the skeletonized cancellous bone per cm3. The node density is here shown for a small sample of primates over the coronal (L‐M‐S‐I) and para‐sagittal (A‐P‐S‐I) planes. The density increases from blue to red. (A, anterior; P, posterior; S, superior; I, inferior; L, lateral; M, medial)
