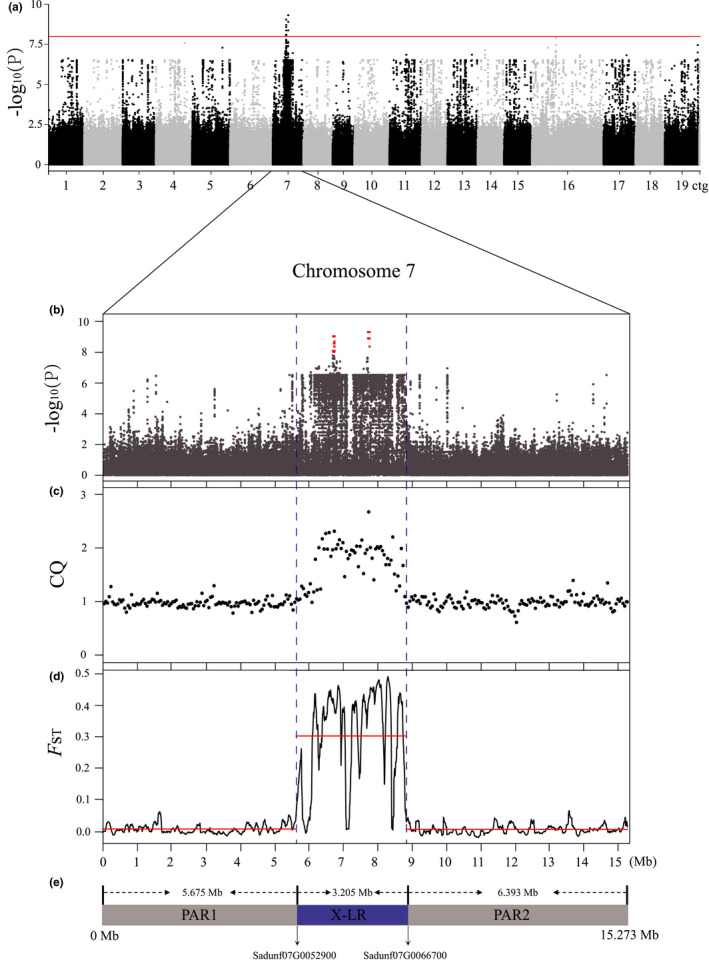
FIGURE 2.

Identification of the sex‐determination systems of Salix dunnii. (a) Results of genome wide association studies (GWAS) between SNPs and sexes in 38 individuals. The y axis is the negative logarithm of p values, and the red line shows the Bonferroni‐corrected significance level corresponding to α < 0.05. (b) Manhattan plot for GWAS p‐values of all SNPs of chromosome 7. Red dots show significantly sex‐associated SNPs. (c) Chromosome quotients (CQ) in 50‐kb nonoverlapping window of chromosome 7. (d) F ST values between the sexes for 100‐kb overlapping windows of chromosome 7 calculated at 5‐kb steps. Red lines represent three significant regions on chromosome 7 suggested by changepoint analysis. (e) The positions of PAR1, X‐LR and PAR2 of chromosome 7
