
Figure 2.
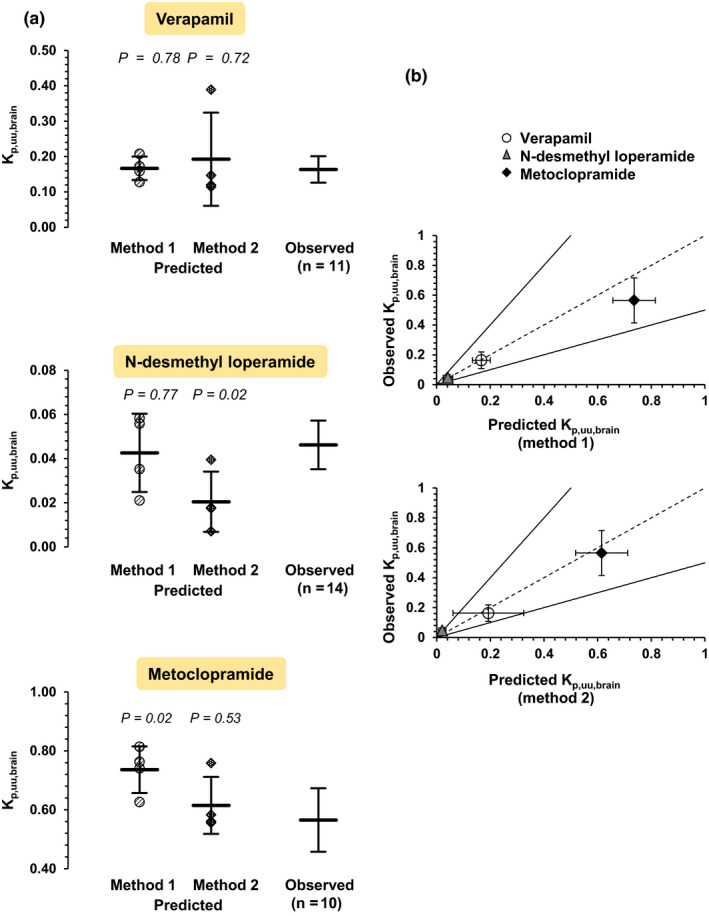
Verification of predictions of Kp,uu,brain values of the three drugs by the observed PET imaging data.12, 13, 14 (a) Individual predicted Kp,uu,brain values (with mean ± standard deviation of four independent experiments) are shown for method 1 (i.e., from in vitro ER (efflux ratio)) and method 2 (i.e., from in vitro CL (intrinsic clearances)). The average observed values with their CI95% (95% confidence intervals) are also shown. The predicted Kp,uu,brain using method 1 fell within the CI95% of the observed in vivo Kp,uu,brain for verapamil and N‐desmethyl loperamide, and there was no statistically significant difference between the predicted and observed values. For metoclopramide, there was a statistically significant difference between the predicted and observed values, and the predicted Kp,uu,brain did not fall within the CI95% of the observedin vivo Kp,uu,brain. Using method 2, the predicted Kp,uu,brain for verapamil and metoclopramide were within CI95% of the observed values. Similarly, there was no significant difference between the predicted and observed values for the two drugs. This was not the case for N‐desmethyl loperamide (underestimation greater than twofold and significant difference between predicted and observed values). Statistically significant differences between observed and predicted Kp,uu,brain values were assessed by the Welch’s t‐test. (b) The predicted Kp,uu,brain values using method 1 were within twofold (continuous lines) of the observed values as measured by PET imaging. For method 2, the predicted Kp,uu,brain values were within twofold of observed values for verapamil and metoclopramide but not for N‐desmethyl loperamide (predicted/observed: 0.44). Vertical and horizontal error bars represent the standard deviations of the observed (n = 11 for verapamil, n = 14 for N‐desmethyl loperamide, n = 10 for metoclopramide) and predicted values (n = four experiments), respectively. The dashed line is the line of unity. Kp,uu,brain, steady‐state unbound brain interstitial fluid‐to‐plasma concentration ratio; PET, positron emission tomography. [Colour figure can be viewed at wileyonlinelibrary.com]