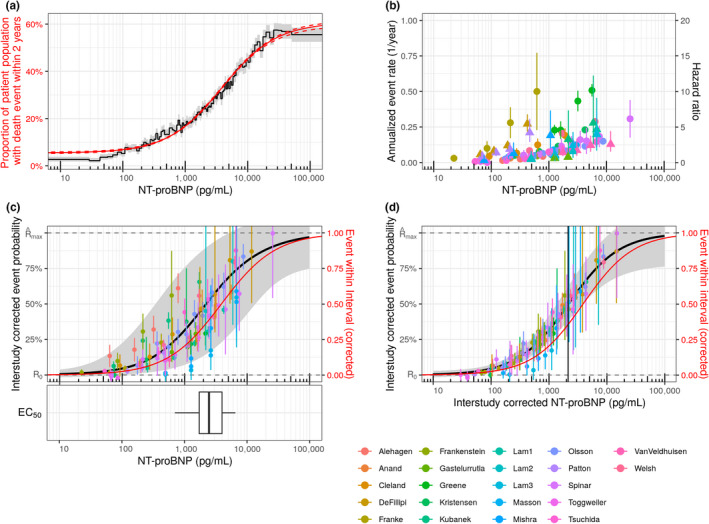
Figure 2.

NT‐proBNP dependent risk in RWD and clinical studies. (a) Proportion of patients dying within 2 years after initial HF diagnosis calculated for percentiles of the NT‐proBNP distribution in the population. Data derived from Explorys medical record database (black line: point estimates; gray band: 95% CI). Data is compared with the model prediction obtained from the Emax‐like function (red line: median; dashed line: 95% CI). By design, every NT‐proBNP bin is supported by an even number of patients (one percentile) but spans an NT‐proBNP range of varying width. (b) Hazard ratios (triangles) and annualized event rates (circles) vs. NT‐proBNP concentrations as reported in original publications (see Table 1). (c) Black line: Median of model simulations. Gray area: 95% CI of simulations including uncertainties of all model parameters and interstudy variability of EC50. Symbols: Event rates corrected for interstudy variabilities of R0 and Rmax. Red line: Model simulation from a. The box‐whisker plot depicts the distribution of study‐specific EC50 values and reflects interstudy variability. (d) Model simulations with 95% CI given by the uncertainty of the model parameters. To visualize the effect and extent of interstudy variability, the data points are corrected for interstudy variability of all three parameters. The vertical line depicts the median EC50 of the general model. represents . CI, confidence interval; EC50, concentration associated with the half maximal risk; HF, heart failure; NT‐proBNP, N‐terminal pro‐B‐type natriuretic peptide; Rmax, NT‐proBNP‐dependent maximum risk; R0, NT‐proBNP‐independent baseline risk. [Colour figure can be viewed at wileyonlinelibrary.com]
