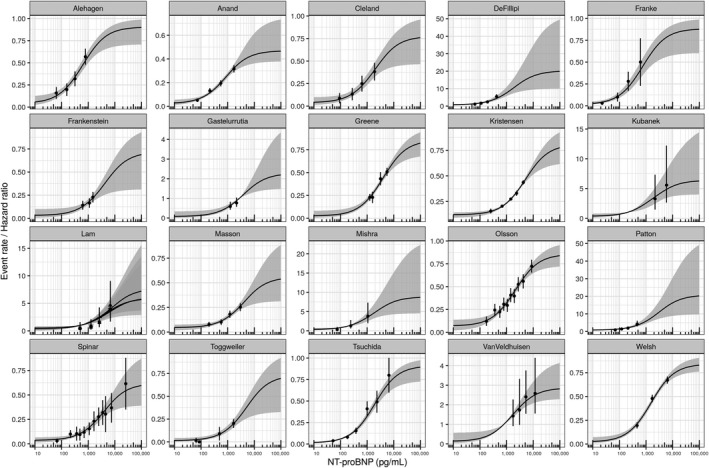
Figure 3.

Comparison of individual study data and model predictions. Median (black line) and 95% percentile (gray area) show NT‐proBNP response predictions per study based on individual study post hoc parameters. The symbols (point estimates) and vertical lines (confidence intervals) represent the original published data the model was built upon. In the case of Lam et al. rEF (cross), mrEF (square), and pEF (triangle) were handled separately. mrEF, medium‐range ejection fraction; NT‐proBNP, N‐terminal pro‐B‐type natriuretic peptide; pEF, preserved ejection fraction; rEF, reduced ejection fraction.
