
Figure 2.
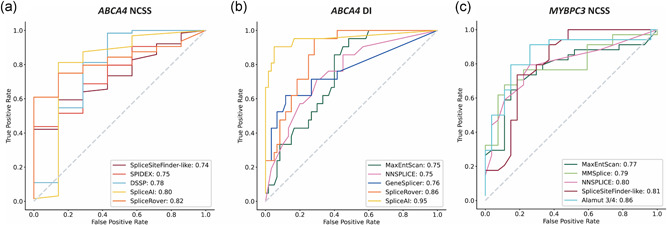
Receiver operator curve (ROC) and area under the curve (AUC) for the five splice prediction tools with the highest AUC for each data set. ROC curves for (a) ABCA4 NCSS variants, (b) ABCA4 DI variants, and (c) MYBPC3 NCSS variants. The AUC values are given in the insets