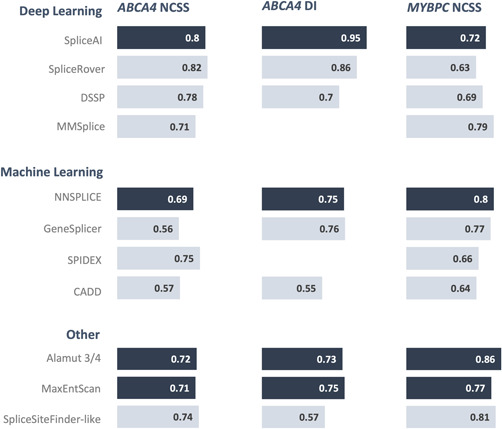
Figure 3.

Comparison of the area under the curve (AUC) for all tools in the three different data sets. In addition to the individual tools, the Alamut 3/4 consensus was included. The best tool for each category is highlighted in dark blue. For the other category, both the Alamut 3/4 consensus approach and MaxEntScan showed comparable high AUC values and are, therefore, highlighted
