
Figure 2.
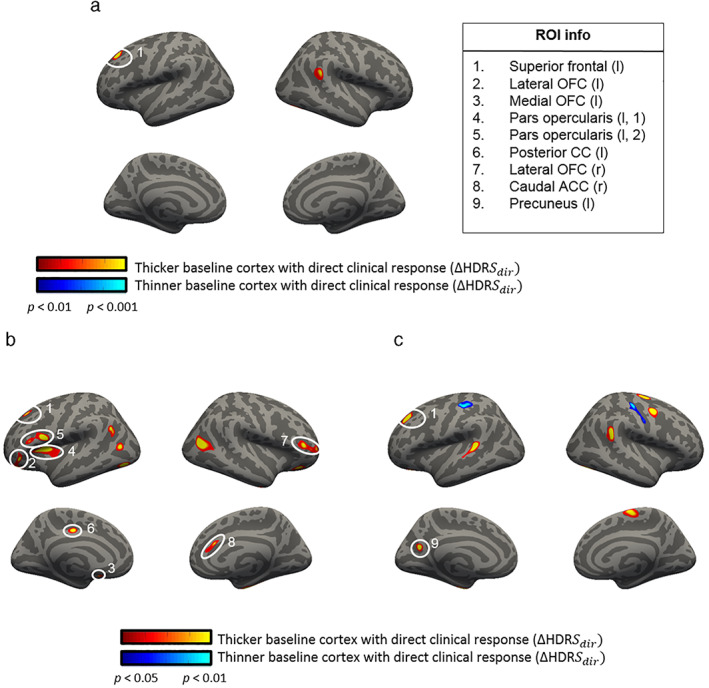
Correlations between baseline cortical thickness (CT) and direct changes in HDRS. Significant correlations between the baseline (T1) cortical thickness and ΔHDRSdir. Figure a includes all subjects (n = 46, order corrected, dof = 40), whereas in figure b and c, results are split for the subjects receiving active aiTBS (n = 21, dof = 18) or sham aiTBS (n = 25, dof = 22), respectively. Note the different statistical thresholds to compensate for the loss of power when studying the subgroups. [Color figure can be viewed at wileyonlinelibrary.com]