
FIGURE 2.
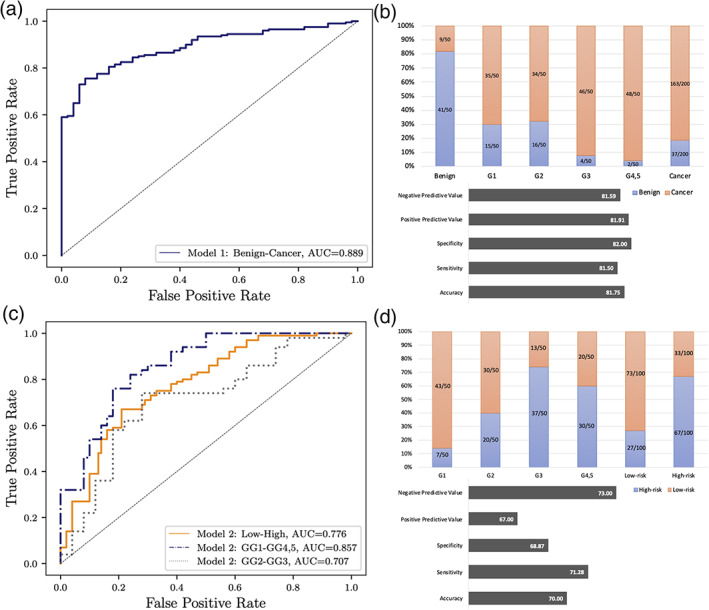
Performance of two trained models for individual patient in the test set. (a) Model 1 performance for classifying cancer vs. benign. (b) The number of patients that were identified correct or incorrect by Model 1, negative predictive value, positive predictive value, specificity, sensitivity, and accuracy for cancer vs. benign. (c) Model 2 performance for classifying high risk vs. low risk. (d) The number of patients that were identified correct or incorrect by Model 2, negative predictive value, positive predictive value, specificity, sensitivity, and accuracy for high risk vs. low risk.