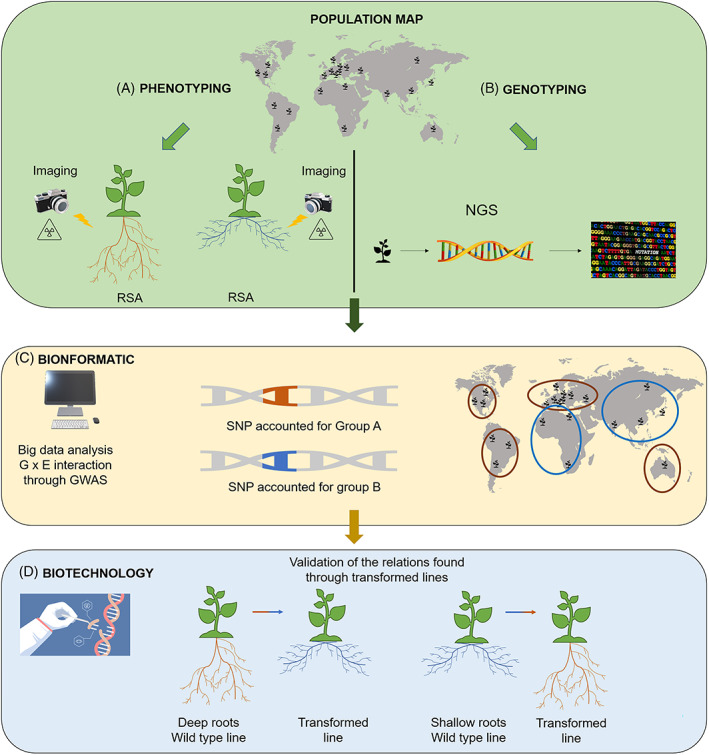
FIGURE 2.

Integrated approach for a population mapping study. To extract data about root system architecture (RSA) within a population requires high throughput phenotyping and genotyping analysis. The main target of new research facilities is to follow root growth in natural condition (in soils) to obtain a realistic RSA profile with no destructive approaches and no invasive technologies. Hi‐tech core facilities and advanced knowledge, i.e. X‐ray micro‐computed tomography (μCT) for phenotyping and next‐generation sequencing (NGS) for genotyping, are promising skills for future scientific research. The grey map is just an example aiming to show the casual distribution of a plant species (e.g. Arabidopsis), with natural accessions adapted to different climate and soil conditions worldwide. Indeed, natural accessions among a population map provide both phenotypic (A) and genotypic (B) variation of RSA traits. (C) Merging phenotypic and genotypic data with the help of bioinformatic techniques, as Genome Wide Association Studies (GWAS), may lead to new correlation, i.e. SNP accounting for similar RSA trait phenotypes across the genetic diversity sampled. In the example of Figure 2, two SNPs accounted for one Group A phenotype (deep rooting) and one Group B phenotype (shallow rooting), respectively, represented with brown and blue circles over the planet. Thus, the map is an example that would represent the distribution of a phenotype of a plant species. (D) The use of transgenic lines with biotechnology approaches, i.e. CRISPR Cas‐9, are pivotal for the validation of relation found with GWAS. To characterise the genes involved in the shaping of the phenotype, transformed lines are used where the identified genes are knocked down or overexpressed to revert the root phenotype observed in the wild‐type lines
