
Figure 3.
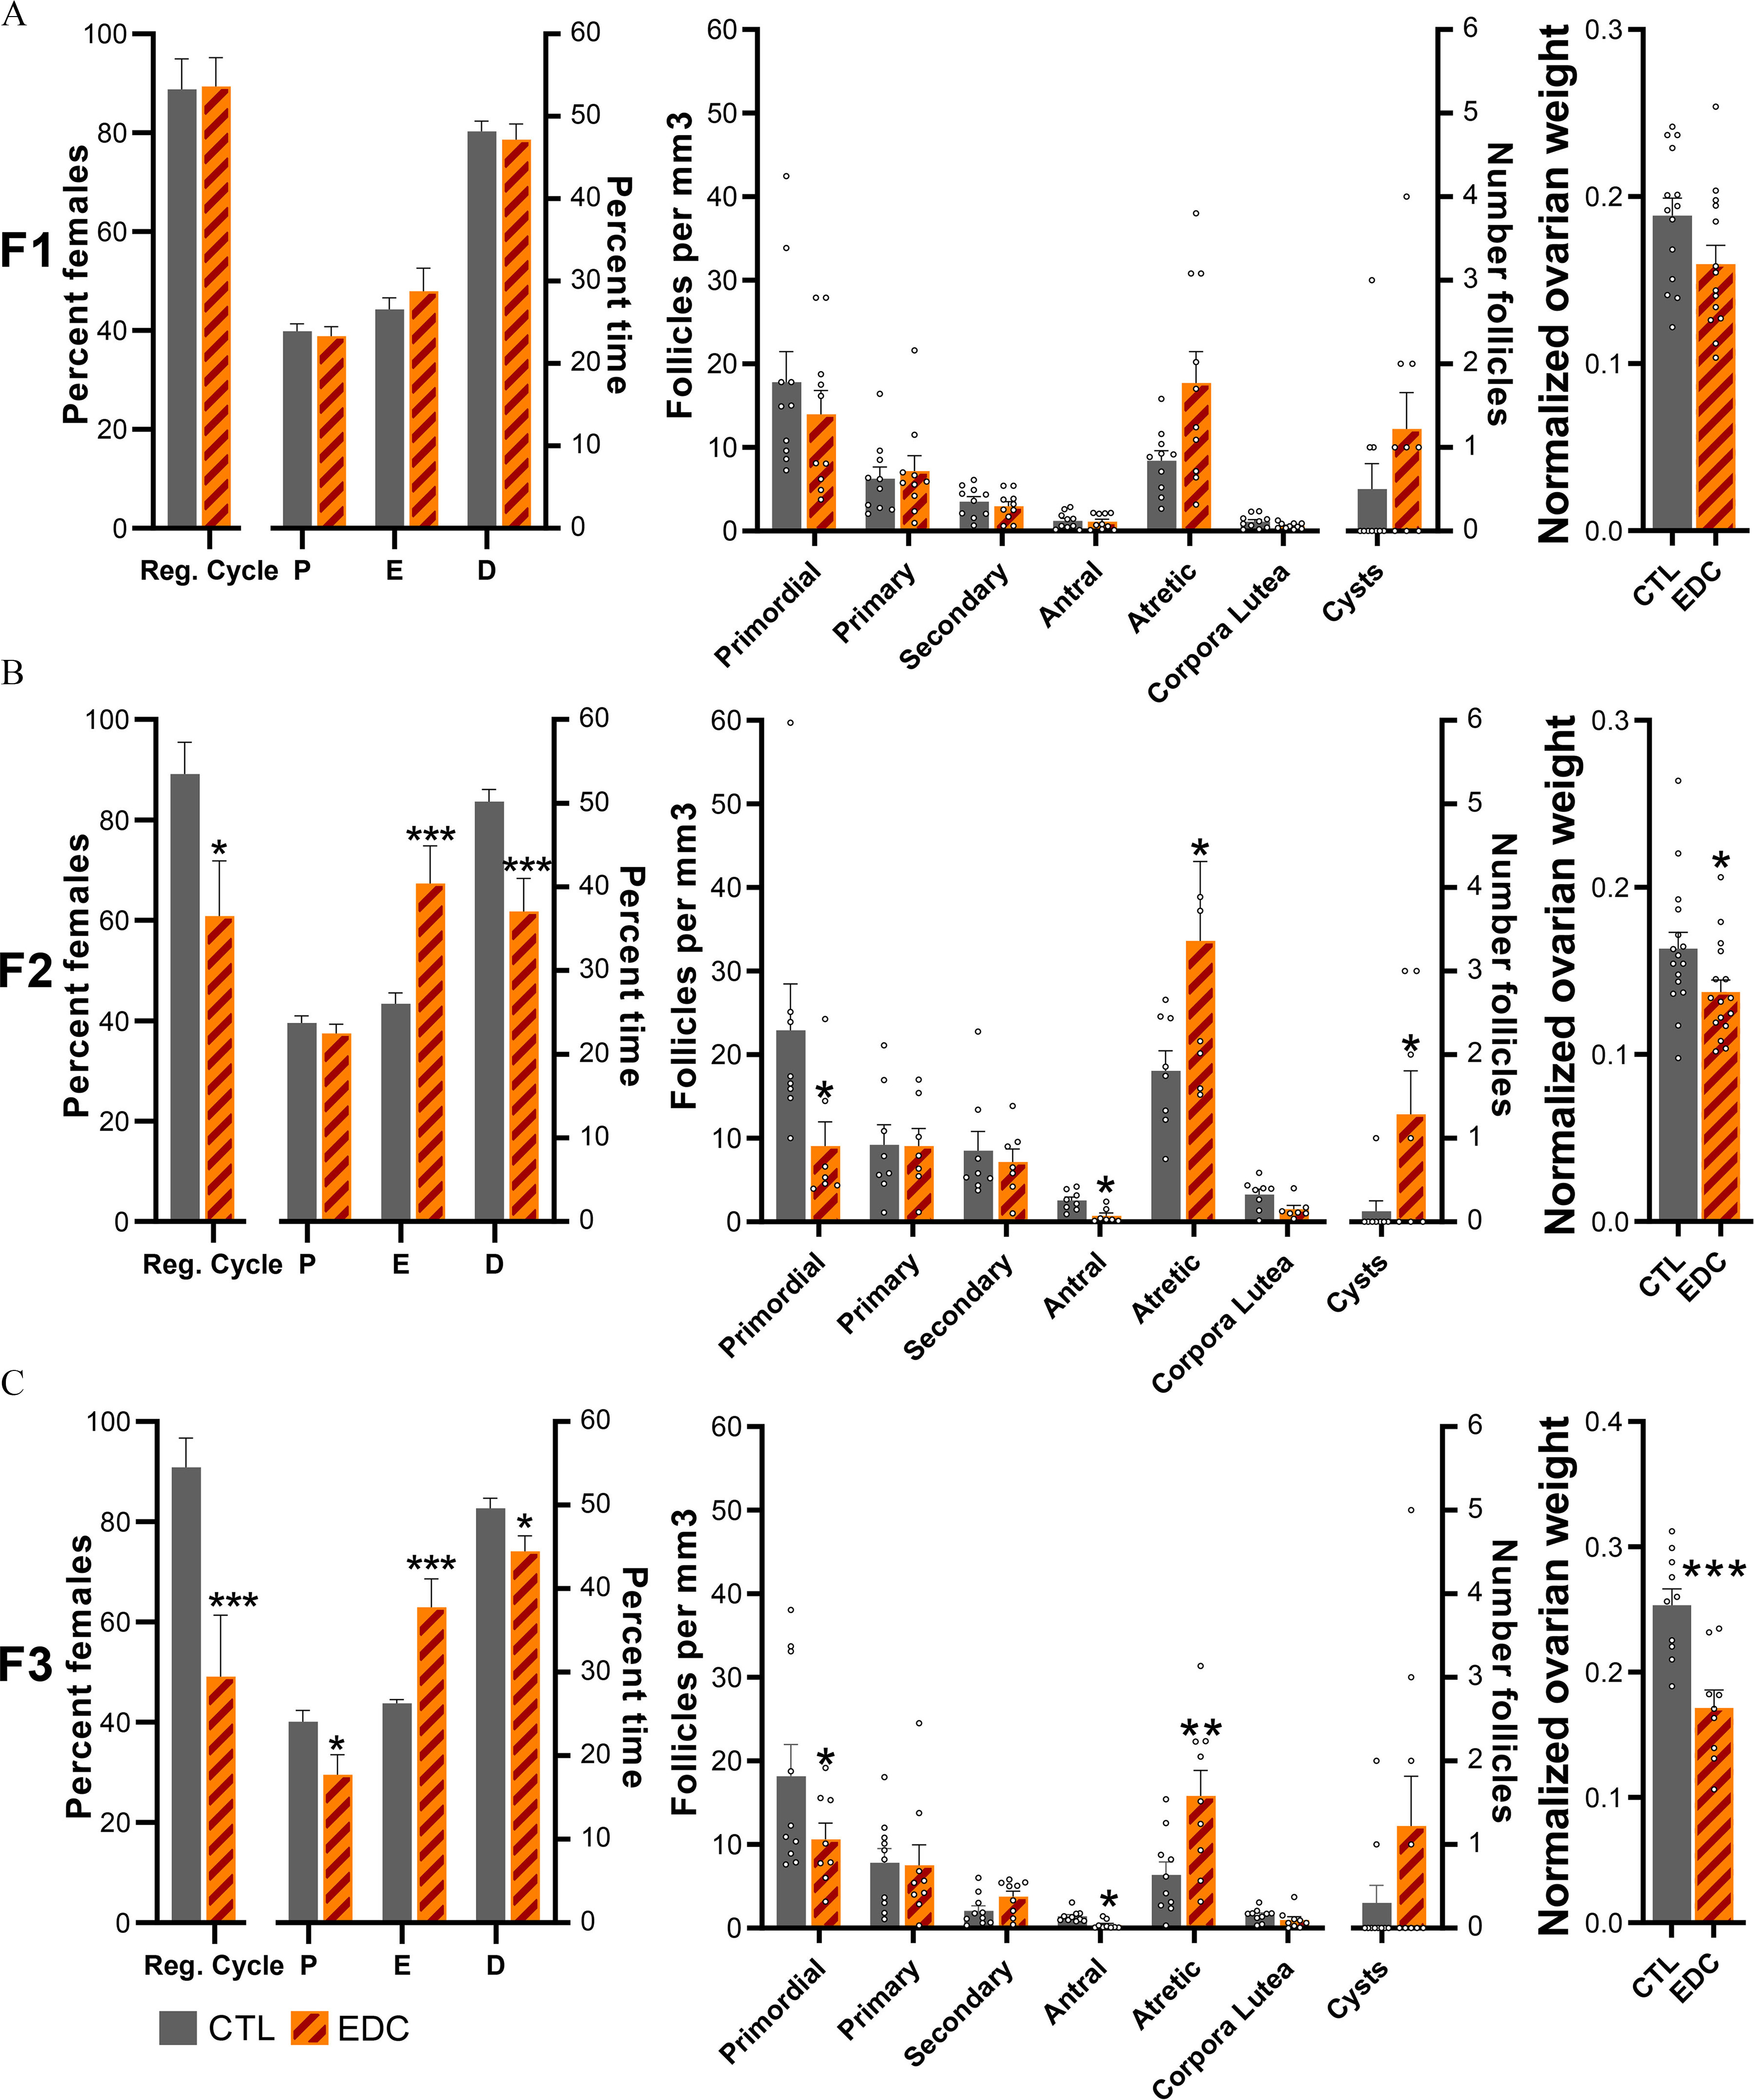
Estrous cycle, ovarian follicle development, and ovarian weight across generation (F1–F3 generation) of female rats exposed to EDC mixture or vehicle (F0 generation). (A–C, left) Percentage of females showing regular cycle and average time spent in each stage of the estrous cycle in F1 (), F2 (), or F3 () animals. Samples originate from eight different litters per group per generation. Data were analyzed using a two-way ANOVA (A–C, middle). Average number of ovarian follicles, corporal lutea, and cysts per cubic millimeter in F1, F2, and F3 females at P60 (). Samples originate from eight different litters per group per generation. Data were analyzed using a two-way ANOVA (A–C, right). Normalized ovarian weight (ovarian weight per body weight in grams) measured at P60 in F1 (), F2 (), and F3 () females. Samples originate from eight different litters per group per generation. Data was analyzed using Student’s -test. Bars represent (*, **, *** vs. CTL). Summary data are reported in Table S3. Note: ANOVA, analysis of variance; CTL, control; D, diestrus; E, estrus; EDC, endocrine-disrupting chemical; P, proestrus; Reg. cycle, regular cycle; SEM, standard error of the mean.