. 2021 Aug 12;129(8):087003. doi: 10.1289/EHP8795

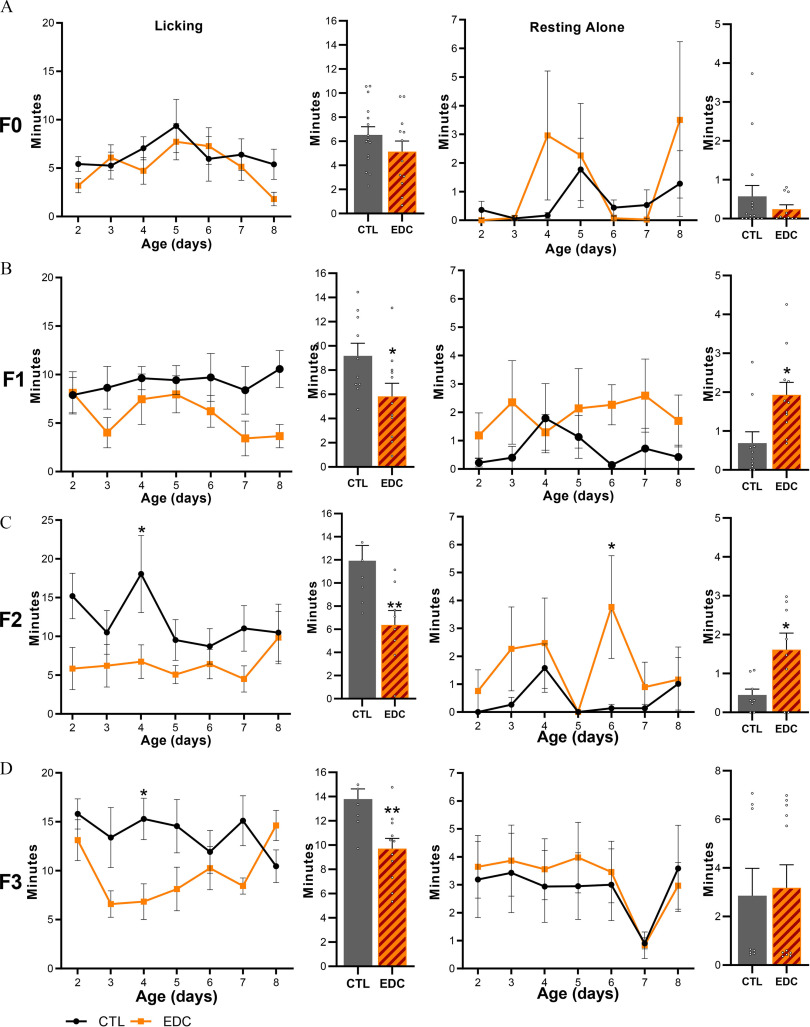
Figure 5.

Figures 5a, 5b, 5c, and 5d each are a set of two line graphs and two bar graph. The first line graph titled licking plots uppercase f 0, uppercase f 1, uppercase f 2, uppercase f 3 minutes, ranging from 0 to 20 in increments of 5, 0 to 20 in increments of 5, 0 to 25 in increments of 5, and 0 to 20 in increments of 5 (y-axis) across age (days), ranging from 2 to 8 in unit increments (x-axis) for control and endocrine disrupting chemicals, respectively. The second line graph titled resting alone plots minutes, ranging from 0 to 7 in unit increments (y-axis) across age (days), ranging from 2 to 8 in unit increments (x-axis), respectively. The first bar graph, plotting minutes, ranging from 0 to 16 in unit increments (y-axis) across control and endocrine disrupting chemicals, respectively. The second bar graph plots minutes, ranging from 0 to 5 in unit increments, 0 to 5 in unit increments, 0 to 5 in unit increments, 0 to 8 in increments of 2 (y-axis) across control and endocrine disrupting chemicals, respectively.

Maternal behavior displayed by female rats exposed to a mixture of EDC throughout four generations. (A–D, left) Time spent by dams displaying licking and grooming behavior toward pups after direct (F0 generation, n=15/group), in utero, and through lactation (F1 generation, n=1011/group, obtained from 5 different litters per group), germ-cell (F2 generation, n=11/group obtained from 5 different litters per group) or ancestral (F3 generation, n=11/group, obtained from 5 different litters per group) exposure to an EDC mixture or vehicle from P2 to 8. Bar graphs show pooled time spent licking and grooming from P2–8. (A–D, right). Time spent by dams resting alone outside the nest not being involved in maternal care in F0–F3 females. Bar graphs show pooled time spent resting alone from P2–8. Plotted lines represent average time±SEM (*p<0.05 vs. CTL, two-way ANOVA followed by Sidak’s multiple comparisons test). Summary data are reported in Table S3. Note: ANOVA, analysis of variance; CTL, control; EDC, endocrine-disrupting chemical; SEM, standard error of the mean.