
Figure 6.
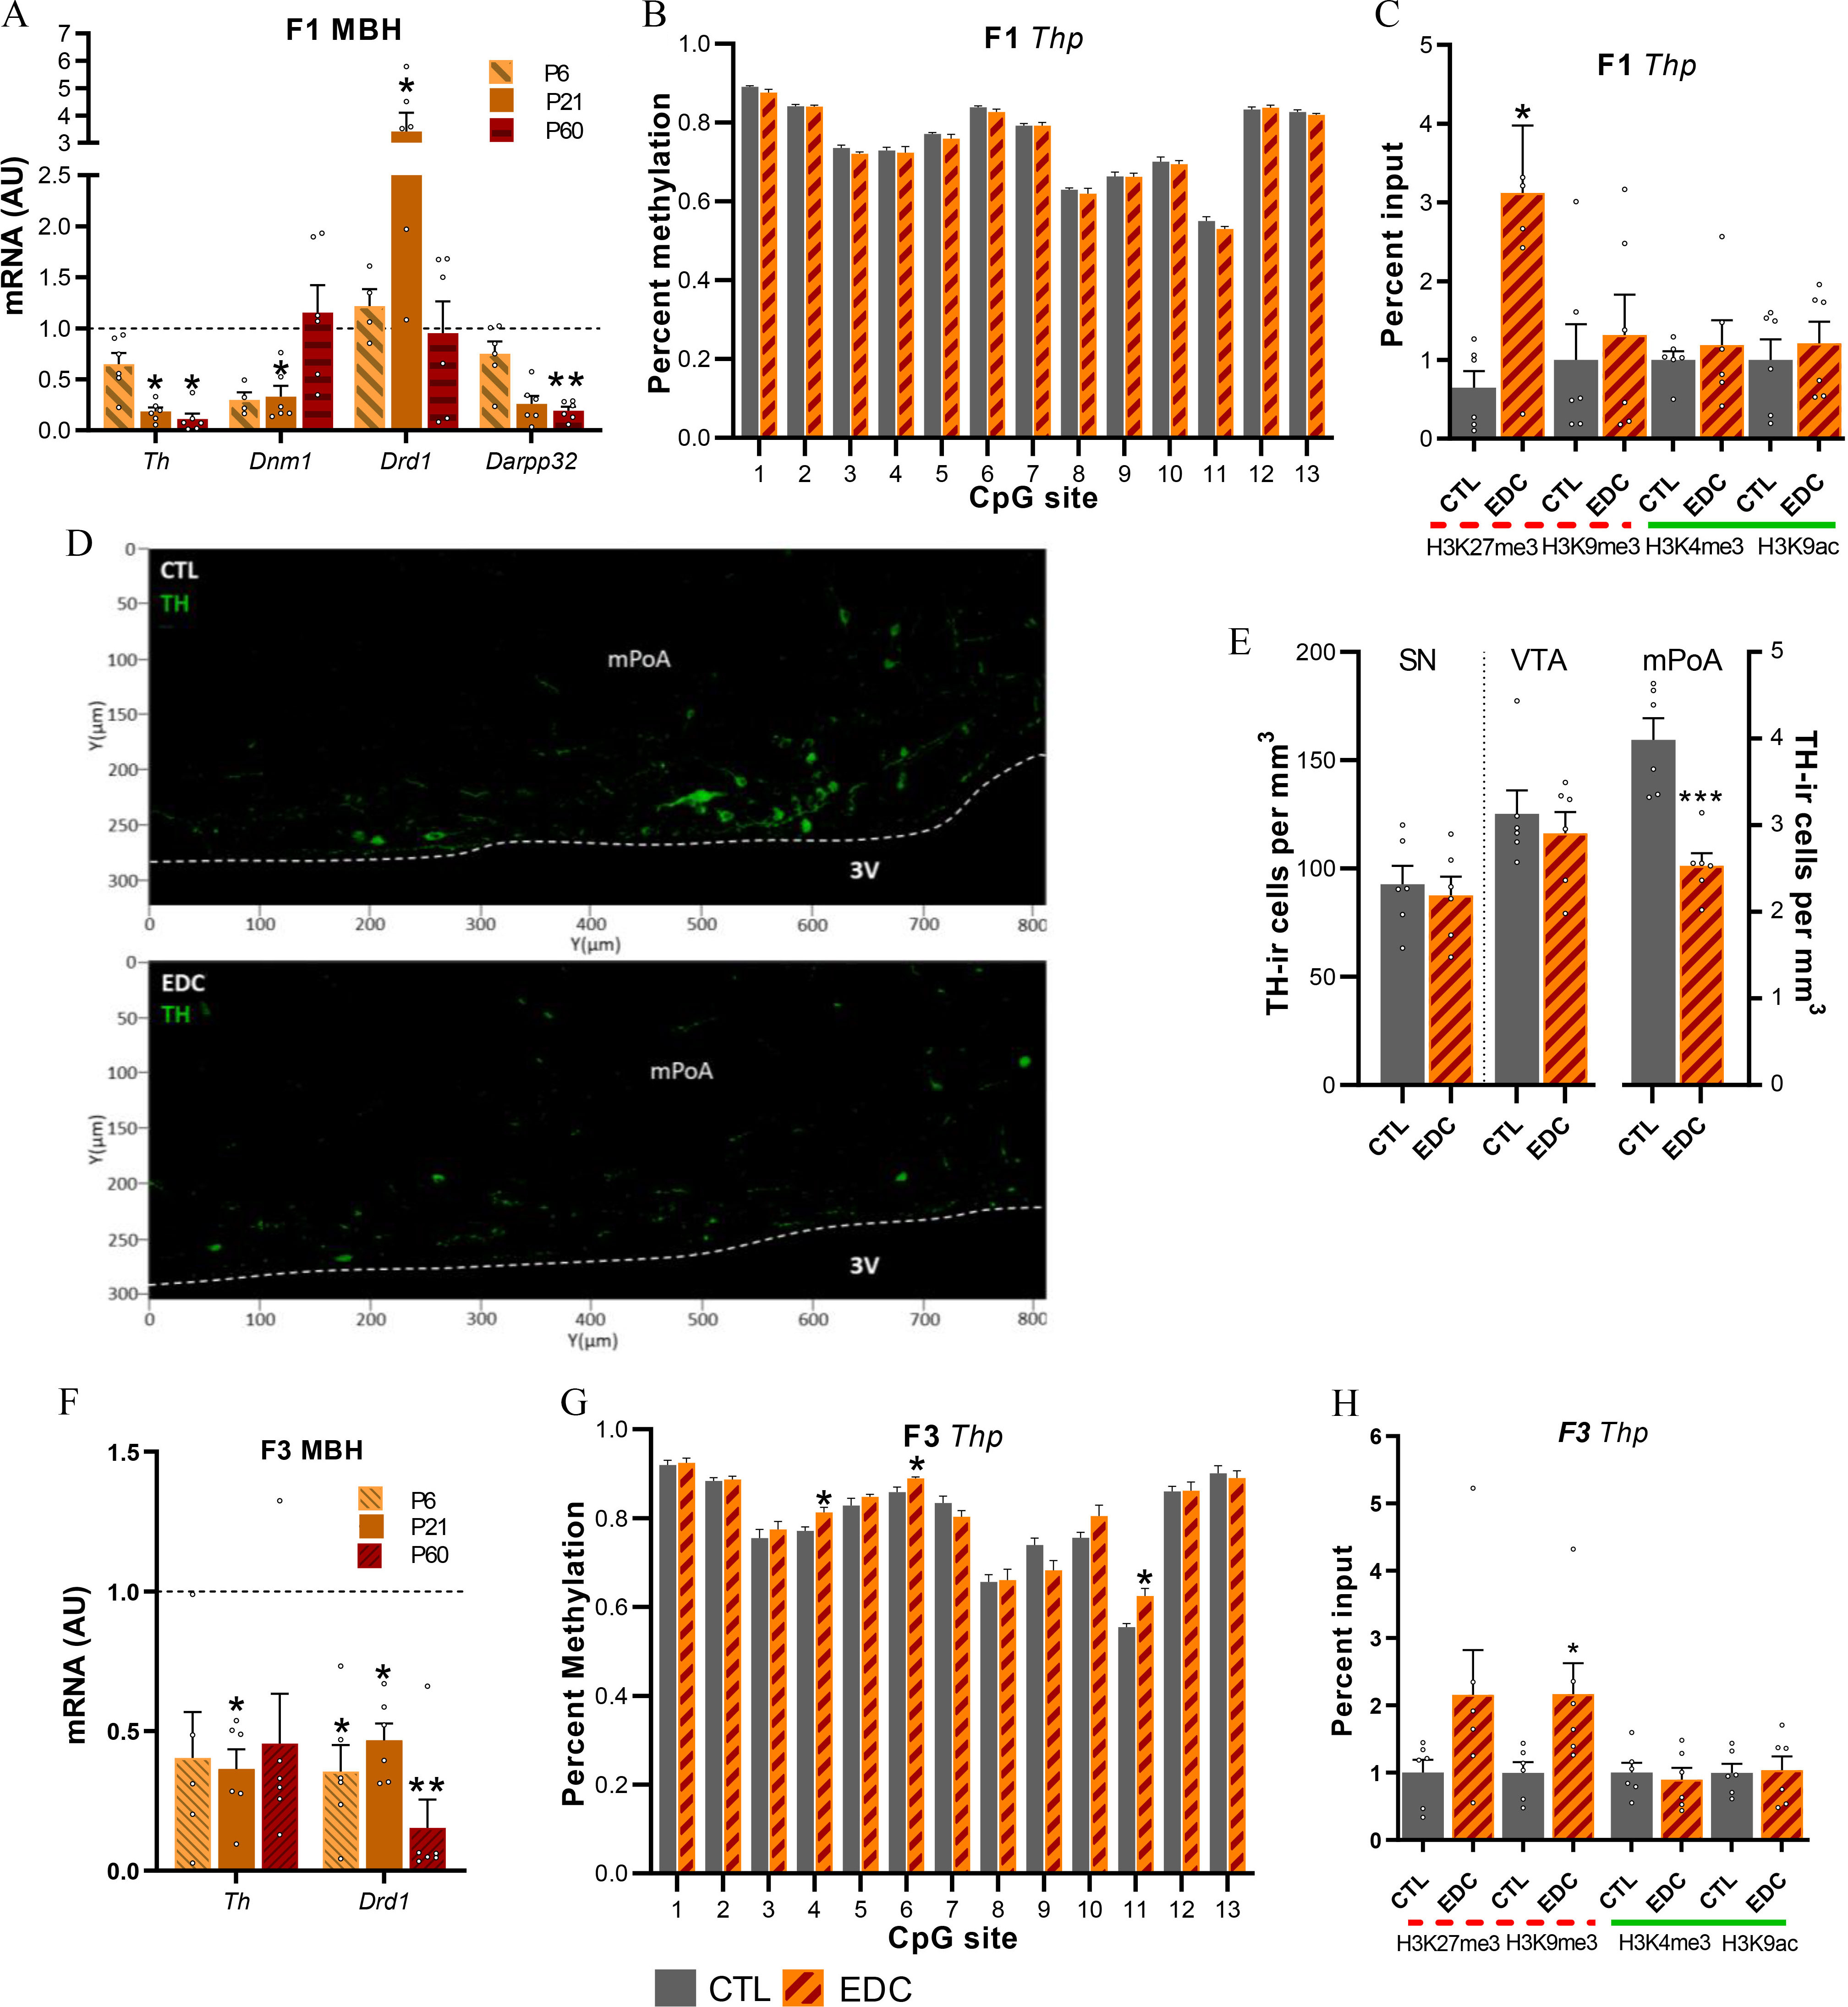
Dopaminergic signaling proteins, mRNA expression and chromatin state in the female rat in utero (F1 generation) and ancestrally (F3 generation) exposed to EDC mixture or vehicle. (A) Expression of Th, Dnm1, Drd1, and Darpp32 mRNA in the MBH-PoA of infant (P6), prepubertal (P21) and adult (P60) F1 female as determined by qPCR (). Samples originates from six different litters per group. RNA expression data were normalized by dividing each individual value by the control group average value at every time point. (B) Methylation state at 13 CpG sites of the Th gene promoter from MBH-PoA explants of F1 females at P21 (). Samples originates from six different litters per group. (C) Abundance of the TrxG-dependent activating marks H3K4me3 and H3K9ac and the PcG-dependent repressive mark H3K27me3 and H3K9me3 at the Th promoter in the prepubertal MBH-PoA of F1 females, as measured by ChIP (). Samples originate from 6 different litters per group. (D) Abundance of Th-immunoreactive cells (green) within the mPoA of F1 prepubertal female rats. (E) Quantification of Th immunoreactivity in the SN, VTA, and mPoA of F1 females. Bars represent mean number of cells per ; (F) Expression of Th and Drd1 mRNA in the MBH-PoA of infant (P6), prepubertal (P21), and adult (P60) F3 females (). Samples originates from 6 different litters per group. (G) Methylation state at 13 CpG sites of the Th gene promoter from MBH-PoA explants of F3 females at P2 () Samples originates from six different litters per group. (H) Abundance of H3K4me3, H3K9ac, H3K27me3, and H3K9me3 histone posttranslational modifications at the Th promoter in the prepubertal MBH-PoA of F3 females, as measured by ChIP (). Dotted red lines represent repressive histone modifications (H3K27me3 and H3K9me3). Green solid lines represent activatory histone modifications (H3K27me3 and H3K9ac). EDC data from panels A, C, F, and H were normalized to control data. Samples originates from six different litters per group. Bars represent (*, **, *** vs. CTL). Data was analyzed using either two-way ANOVA (6A), followed by Sidak’s multiple comparisons test or Student’s -test (6B–H). Summary data are reported in Table S3. Note: 3V, third ventricle; ANOVA, analysis of variance; AU, arbitrary units; ChIP, chromatin immunoprecipitation; CTL, control; EDC, endocrine-disrupting chemical; SN, substantia nigra; Th, tyrosine hydroxylase; VTA, ventral tegmental area.