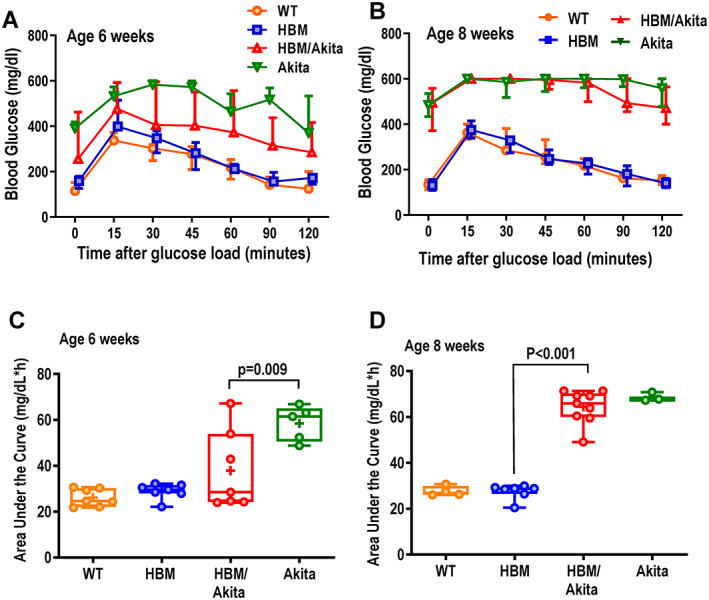
Fig. 5.

ipGTT. (A,B) Blood glucose before and after an intraperitoneal glucose load (1.5 g/kg) in the four genotype groups at age 6 (WT, HBM, and HBM/Akita, n = 7; Akita, n = 5) and 8 weeks (WT, Akita, n = 4; HBM, n = 7; HBM/Akita, n = 9). (At 6 weeks: p > .10 at all time points for HBM/Akita relative to all the other groups; p < .01 for Akita relative to WT and HBM [except 120 min, when p = .018, and p = .027, respectively]; at 8 weeks: p < .001 for Akita and HBM/Akita vs. WT and HBM at all time points [two‐way ANOVA and Tukey's multiple comparison test]). (C,D) Area under the curve for blood glucose during the ipGTT at 6 and 8 weeks of age. Brackets indicate adjusted p values (Tukey's multiple comparison test) after one‐way ANOVA. Pairwise comparisons with p > .10 are not indicated. Abbreviations: ANOVA, analysis of variance; HBM, high bone mass; ipGTT, intraperitoneal glucose tolerance test; WT, wild‐type.
