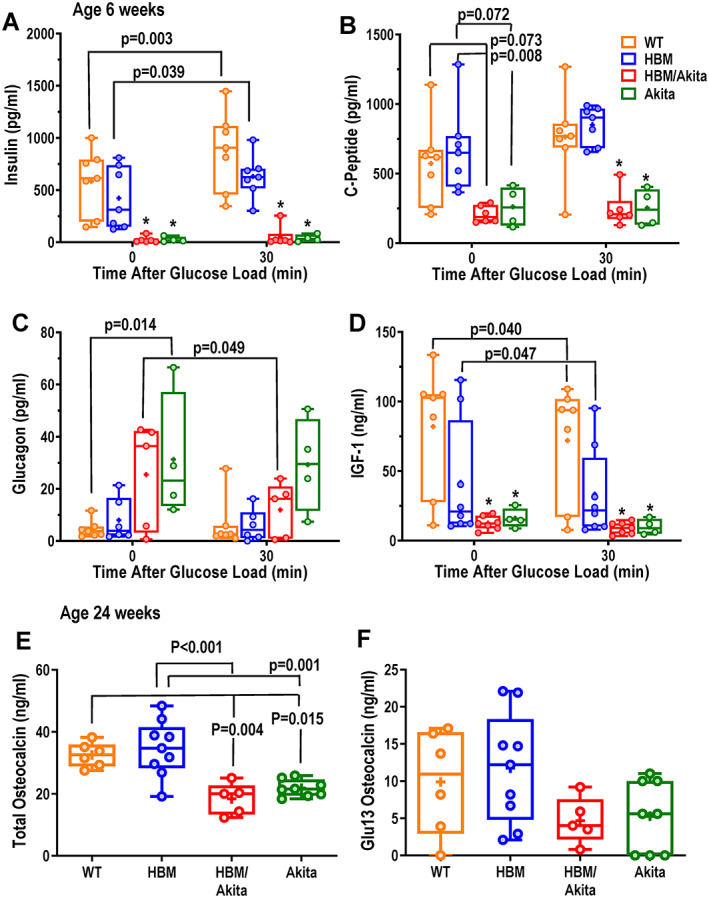
Fig. 7.

Glucose regulating hormones and osteocalcin. (A) Serum insulin, (B) C‐peptide, (C) glucagon and (D) IGF‐1 measured before (time 0) and 30 min after a glucose load (i.p. dextrose, 1.5 mg/g) in 6‐week‐old mice. (E) Serum total and (F) decarboxylated (Glu13) osteocalcin in the four genotype groups at age 28–30 weeks. Brackets indicate adjusted p values (Tukey's multiple comparison test) after two‐way ANOVA; *p < .01 versus WT and HBM at either time point. Pairwise comparisons with p > .10 are not indicated. Abbreviations: ANOVA, analysis of variance; HBM, high bone mass; IGF‐1, insulin‐like growth factor 1; WT, wild‐type.
