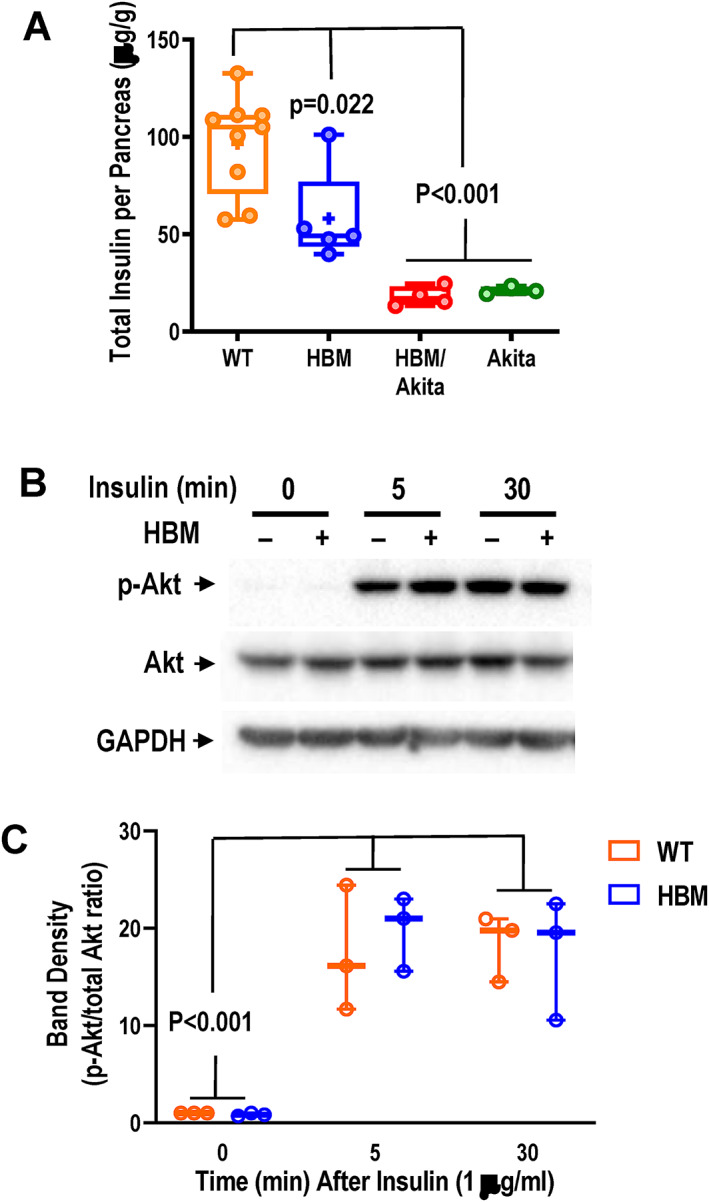
Fig. 8.

Insulin production and signaling. (A) Total pancreatic insulin content assessed by ELISA in whole pancreas homogenates of 6‐week‐old mice. Brackets indicate adjusted p values (Tukey's multiple comparison test) after one‐way ANOVA. (B) Immunoblots of whole‐cell lysates from ear mesenchymal stem cell–derived adipocyte cultures before and after 5 or 30 min of exposure to 1 μg/ml of insulin. (C) Densitometric analysis of immunoblot bands shown in B and Supplemental Figure S5A,B , expressed as pAKT/total Akt ratio. Brackets indicate adjusted p‐values (Tukey's multiple comparison test) after one‐way ANOVA (time, F = 33.82, p < .001; genotype, F = 0.057, p = .815; interaction, F = 0.252, p = .781. Abbreviations: ANOVA, analysis of variance; ELISA, enzyme‐linked immunosorbent assay; pAKT, phosphorylated protein kinase B.
