FIGURE 1.

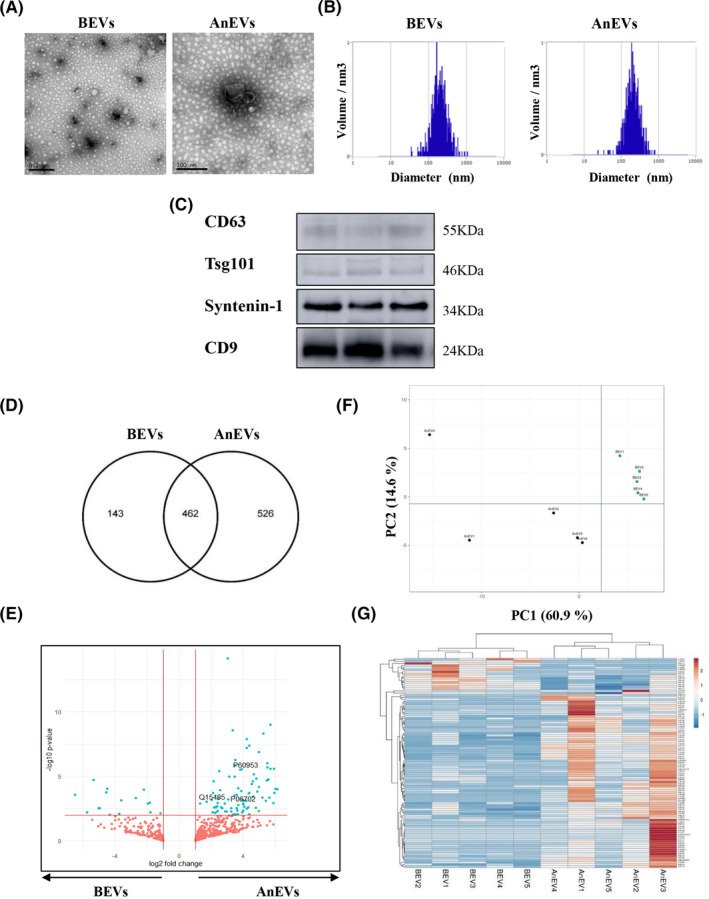
Characterization, proteomic profiling, and differential analysis of AnEVs and BEVs. (A) Transmission electron microscopy images from representative circulating BEVs and AnEVs. Scale bar: 200 nm. Images depict representative EVs from both samples. (B) Seven different EV preparations from each experimental condition were analyzed by NTA. Representative NTA histograms showed average particle sizes of 200 nm for BEVs and AnEvs. (C) AnEVs were characterized by Western blot. Panels show immunoblots from three representative patients. Bona fide EV markers, such as CD63, TSG101, Syntenin‐1, and CD9 were detected. (D) Venn diagram of brute data obtained by mass spectrometry‐based quantitative proteomics representing the intersection between detected proteins in BEVs and AnEVs. (E) Volcano plot showing all proteins identified. Statistically significant differences (p > .05) in the AnEVs (right side) and in the BEVs (left side) appear in blue. Access number (UniProt) for proteins of interest (CDC42, Ficolin‐2, S100A9) are shown. Principal component analysis (F) and unsupervised hierarchical clustering (G) of plasma‐derived EVs
