
FIGURE 2.
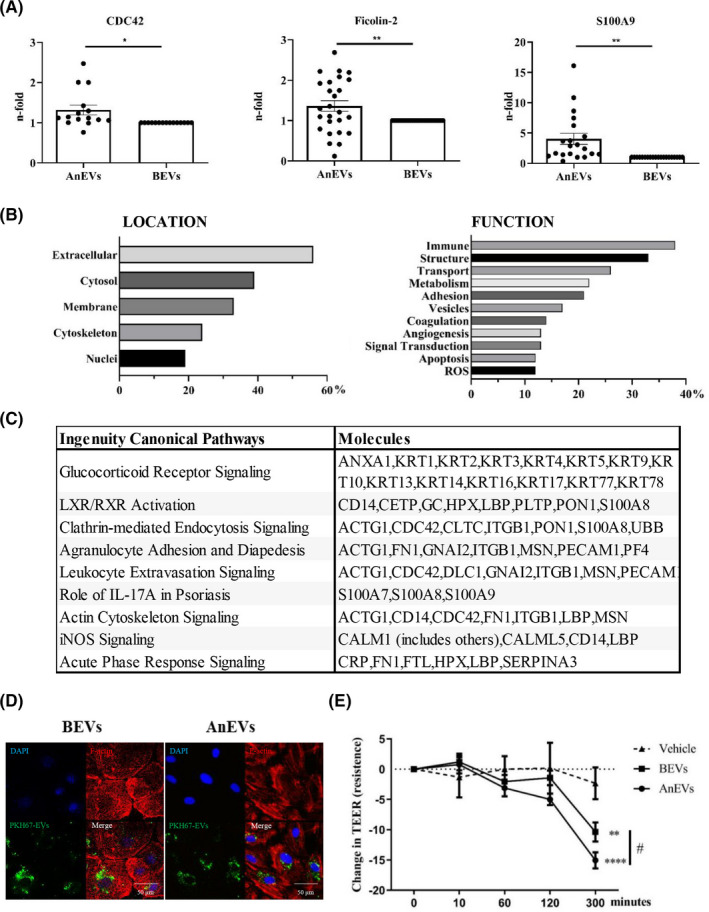
Functional protein association networks in AnEVs. (A) CDC42, S100A9, and Ficolin‐2 are increased in AnEVs. The graphics represent the abundance protein levels expressed as the quantified ratio (AnEVs/BEVs and BEVs/BEVs) of a larger group of anaphylactic plasma paired samples. CDC42 (*p = .0137, n = 15, MW=21 KDa), S100A9 (**p = .0017, n = 20, MW = 14 KDa), Ficolin‐2 (**p = .0092, n = 26, MW = 34 KDa). (B) Classification of the main cellular localization and function of the protein panel based on the UniProt database. (C) Top Canonical Pathways obtained by IPA and symbols of the molecules. (D–E) HMVEC‐Ls were incubated with 100 µg/ml of purified BEVs and AnEVs. The images reveal PKH67‐EVs around the nuclei (DAPI) and cytoskeletal fibers (F‐actin) from a representative paired EVs patient sample from 4 performed (D). (E) The graphic shows the change in TEER measurements after the addition of BEVs and AnEVs (n = 16 patients). Two‐way ANOVA followed by the Bonferroni test was performed: **p = .0033, ****p ≤ .0001 versus Vehicle (EBM + PBS); #p = .0285 versus BEVs)