
FIGURE 5.
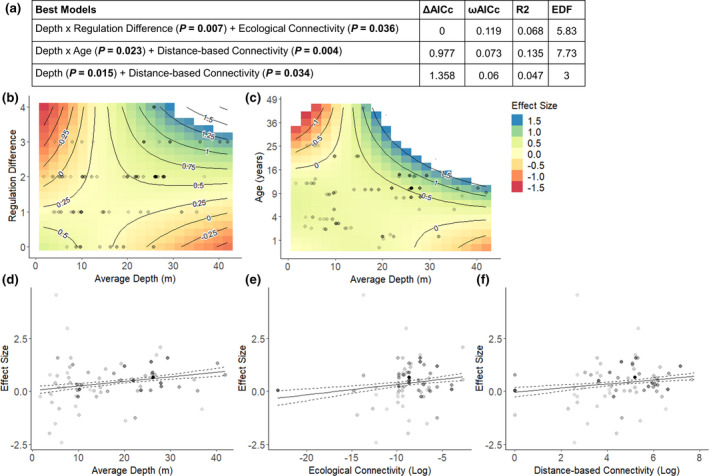
(a) Top models for explaining the effectiveness of marine reserves to increase biomass of fished species. Difference between lowest reported corrected Akaike information criterion (ΔAICc), AIC weights (ωAICc), variance explained (R 2) and effective degrees of freedom (EDF) are reported for model comparison. Relationship of log‐ratio effect sizes for fished biomass with (b) the interaction between depth and regulation difference (c) depth and age (d) marine reserve depth, (e) ecological connectivity and (f) distance‐based connectivity. The contours in plots (b) and (c) represent the predicted effect sizes based on the interactions. In plots (d‐f) the solid line is a fitted GAM curve and dashed line a standard error confidence band. For all plots darker dots represent effect sizes with a greater weighting based on the inverse of variance