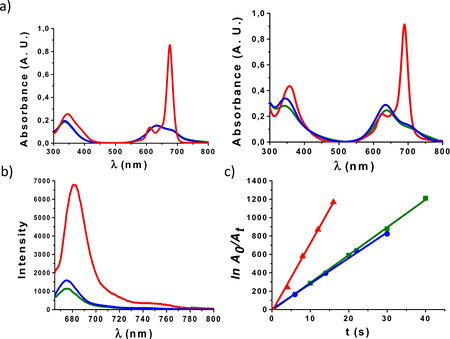
Figure 2.

a) UV/vis spectra of 1 (left) and 2 (right) in DMF (red), water (green) and PBS (blue) at 7 μM. b) Fluorescence spectra of 1 (blue), 2 (green) and non‐substituted ZnPc (red) in DMF at 1 μM; λ ex=665, 679, and 660 nm, respectively. c) Plot of the decrease in DPBF absorption with time, photoinduced by 1 (blue), 2 (green) and non‐substituted ZnPc (reference compound, red), which correlates with the amount of singlet oxygen produced by each of these PS.
