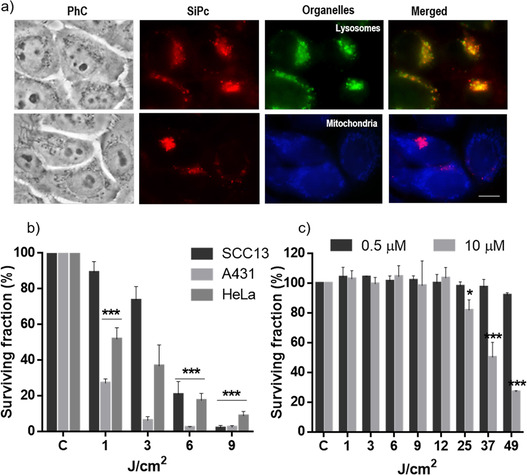
Figure 3.

a) Subcellular localization of ZnPc‐SA 1 in SCC‐13 cells after 18 h of incubation at 10 μM of PS (similar data are presented for hybrid 2 in Figure S7); PhC: phase contrast. Red fluorescence is from the ZnPc, green fluorescence from lysosomes, and blue fluorescence from mitochondria. The merged image shows the ZnPC‐SA and each organelle together. A blue (450–490 nm) exciting lamp was used for LysoTracker (top row) and UVA (360–370 nm) exciting lamp was used for MitoTracker (bottom row), while green (545 nm) exciting light was used for the ZnPc‐SA derivative. Scale bar: 10 μm. b) Survival of SCC‐13, A431 and HeLa cells after 5 h of incubation with compound 1 (0.5 μM) followed by different light doses. c) Survival of SCC‐13 cells after 5 h of incubation with compound 2 (0.5 and 10 μM) followed by different light doses. Cell survival was evaluated 24 h after irradiation by the MTT assay. Each point corresponds to the mean value±SD obtained from three independent experiments. *P<0.05, **P<0.01, ***P<0.001.
