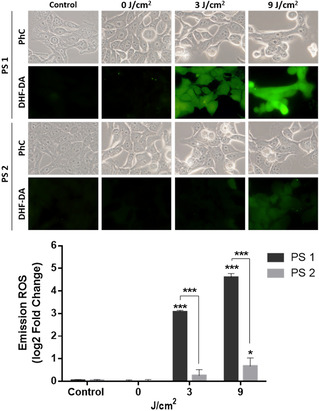
Figure 5.

ROS production detected by the DHF‐DA fluorescent probe after PDT with the ZnPc‐SA biohybrids 1 (top) and 2 (bottom) under irradiation with different red light doses. 1st column: Control experiment in the absence of PS. 2nd column: Cells maintained in the dark, as a second control. 3rd and 4th columns: Cells irradiated with two different light doses. A fluorescence signal indicative of ROS production was observed by fluorescence microscopy (λ ex=436 nm). The intracellular fluorescence intensity was measured by ImageJ (B). *P<0.05, ***P<0.001. PhC: phase contrast images, for analysis of the effect of the PDT treatment on the cells morphology.
