
Figure 2.
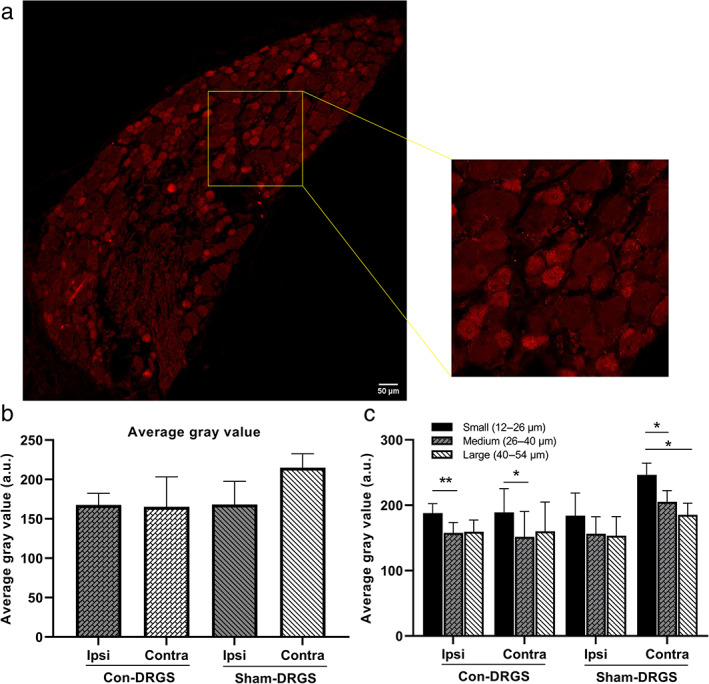
a. Representative photomicrograph of anti‐GABA immunostaining. Note the difference in staining intensity between the large and small diameter somata. b. Comparison of average gray values in the ipsi‐ and contralateral DRG of both the Con‐DRGS and Sham‐DRGS treated group. No differences were observed between ipsi‐ and contralateral DRGs in both the Con‐DRGS and Sham‐DRGS group, nor were differences observed between the Con‐DRGS and Sham‐DRGS group in both the ipsi‐ and contralateral DRG. c. Comparison of average gray values based on soma diameter. Significant differences were observed in intensity of GABA‐immunoreactivity between the small‐sized as compared to the medium‐ and large‐sized soma. No differences were observed between ipsi‐ and contralateral DRGs in both the Con‐DRGS and Sham‐DRGS group for all three soma diameter ranges, nor were differences observed between the Con‐DRGS and Sham‐DRGS group in both the ipsi‐ and contralateral DRG for all three soma diameter ranges. *p < 0.01. [Color figure can be viewed at wileyonlinelibrary.com]