
FIGURE 3.
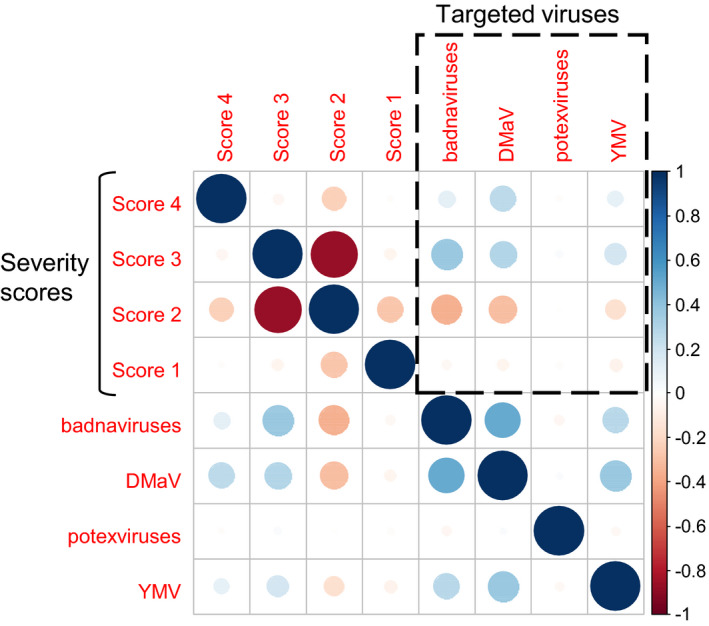
Correlogram obtained using Pearson's matrix correlation coefficients between severity scores based on leaf symptoms and detected viruses. Blue and red spots represent positive and negative correlations, respectively. Dotted black boxed section displays the results of possible correlations between severity scores and the type of detected viruses [Colour figure can be viewed at wileyonlinelibrary.com]