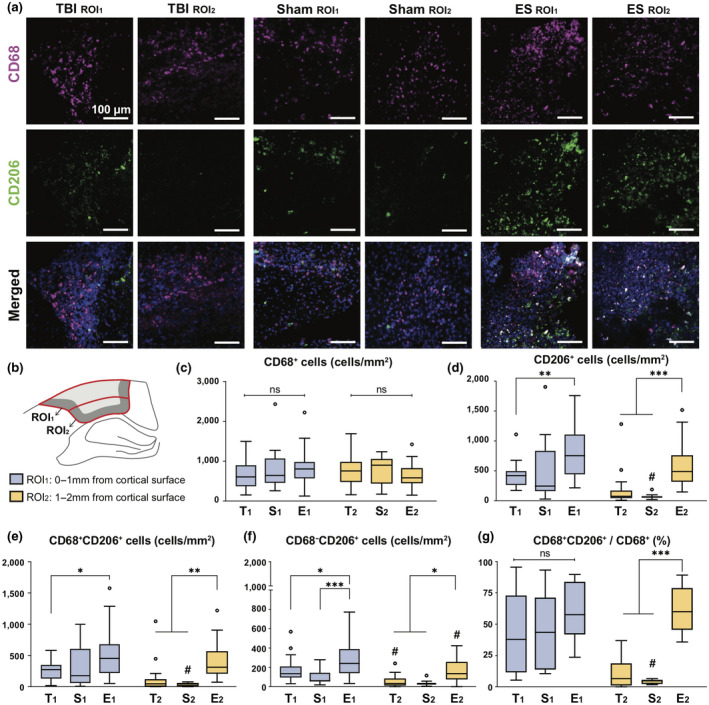
FIGURE 3.

Region‐ or treatment‐dependent expression in CD68 and CD206 at 7 days post‐traumatic brain injury (TBI). (a) Representative fluorescence images of CD68 (magenta), CD206 (green), and DAPI (blue) in ROI1 and ROI2. The detailed description of ROIs is included in the same Figure b. (b) Within the perilesional region, the analyzing window was divided in two: ROI1 and ROI2, positioned within 0–1 and 1–2 mm from the cortex, respectively. T, S, and E on the x‐axis (c–f) or next to symbol (g) represent untreated TBI, sham and ES groups and a lower subscript 1 and 2 represent ROI1 and ROI2. (c) The number of CD68+ cells was not region‐ or treatment dependent. (d) The number of CD206+ cells. Within the ROI1, ES treatment increased the number of CD206+ cells compared to untreated TBI, but not significant with sham. Instead, within the ROI2, CD206+ cells significantly increased by the ES treatment compared to TBI and sham groups. (e) The number of CD68+CD206+ cells showed a similar trend with CD206+ as shown in Figure d. (f) The number of CD68−CD206+ cells apparently increased by ES treatment compared to untreated TBI and sham groups in both ROI1 and ROI2. (g) The proportion of the CD68+CD206+ cells relative to the CD68+ cells. Treatment did not affect the proportion of CD68+CD206+ cells to CD68+ cells in ROI1, but ES treatment effectively increased those values in ROI2. Data are represented as mean ± SD. N = 4, 3, 6 animals with two tissue slices analyzed for untreated TBI, sham, ES. 3–5 images were taken from each ROI; Two‐way ANOVA tests with Tukey's post hoc analysis was performed. *p < 0.05, **p < 0.01, ***p < 0.001 across treatment groups, # < 0.05 across regions
