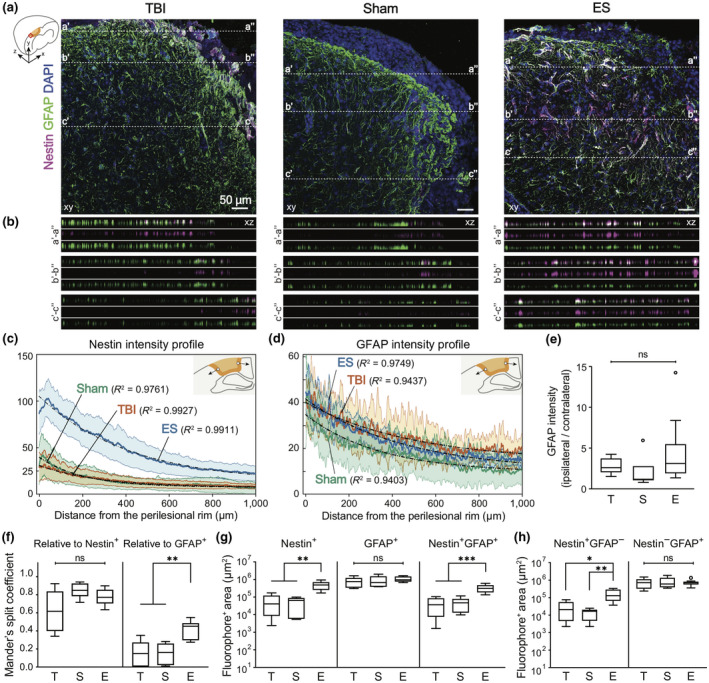
FIGURE 5.

Increased Nestin+ and Nestin+GFAP+ cells in the perilesional cortex at 7 days post‐traumatic brain injury (TBI) by electrical stimulation (ES) treatment. (a) Representative z‐projection (xy) confocal images of the perilesional cortex. Magenta, green, and blue represent Nestin, GFAP, and DAPI, respectively. In Figure a, three representative positions (a–a′, b–b′, c–c′) were chosen to show the differential voxel distribution and their orthogonal views (xz) of the dotted lines in each z‐projection image are in Figure b. (b) Images are listed in order of merged, magenta, and green from the top. From the xz‐section images, it was confirmed that Nestin+ voxels are coincident with GFAP+ voxels (The total depth of z‐stack images: 4, 4, and 7 μm in TBI, sham, and ES groups. The step size: 1 μm). Mean profiles of (c) Nestin and (d) GFAP intensity and 95% confidence intervals (shaded bands). The schematics for the analysis of gradual changes in Nestin and GFAP expression are illustrated in each figure: the blank circle and the arrow indicate the initial point and the direction of analysis, respectively. In all experimental groups, mean intensity was fit to the one‐phase exponential decay curve, and their R 2 values are shown on the graph. (e–h) T, S, and E on the x‐axis represent untreated TBI, sham and ES groups. (e) GFAP intensity ratio of ipsilateral/contralateral cortex was larger than 1, but was not significant among groups, indicating that TBI induced astrocyte activation at the perilesional cortex, but sham or ES operations did not induce additional activation. (f) The degree of GFAP− and Nestin‐concurrent signals with Nestin (left) and GFAP (right), respectively. There was no significant difference in the Mander's split coefficient relative to Nestin+ pixels, whereas more GFAP+ cells appeared to express Nestin signals in the ES group compared to the TBI and sham groups. (g) Quantitative analysis of Nestin+, GFAP+, Nestin+GFAP+ area. Nestin+ and Nestin+GFAP+ area showed a treatment‐dependent change, an increase by the ES treatment. (h) Nestin−GFAP+ area and Nestin+GFAP− area. There was no significant difference in Nestin−GFAP+ area, whereas Nestin+GFAP− area of ES group was significantly larger than untreated TBI and sham groups. Data are represented as mean ± SD for Figure e–h. N = 4, 3, 6 animals with two tissue slices analyzed for untreated TBI, sham, ES; *p < 0.05, **p < 0.01, ***p < 0.001, Kruskal–Wallis one‐way ANOVA with Dunn's post hoc analysis for Figure e and Welch ANOVA with Dunnett post hoc analysis for others
