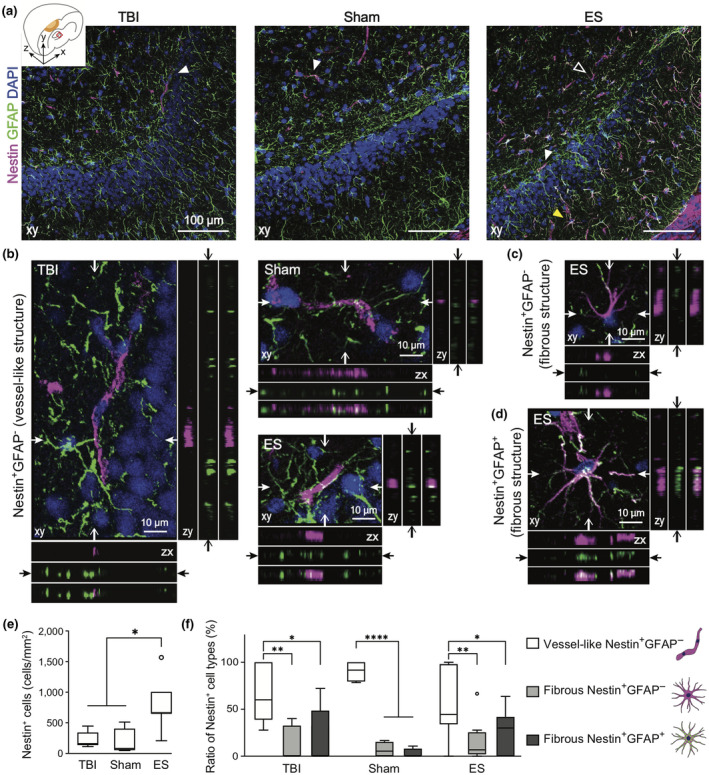
FIGURE 6.

The phenotypes of Nestin+ cells in the ipsilateral hippocampus at 7 days post‐traumatic brain injury (TBI). Magenta, green, and blue represent Nestin, GFAP, and DAPI, respectively. (a) Representative z‐projection (xy) confocal images of the ipsilateral hippocampus. (b–d) Three representative phenotypes of Nestin+ cells, marked with arrowheads in Figure a. In each z‐projection (xy) image, the orthogonal views of the position indicated by arrows are on the bottom (zx) and right (zy) panels. In each bottom and right panels, images are listed in order of magenta, green and merged from the top and left, respectively (The total depth of z‐stack images: 4 μm, the step size: 1 μm). (b) White arrowhead in Figure a indicates Nestin+GFAP− cells, featuring vessel‐like structure. A white empty or yellow arrowhead in Figure a indicates fibrous Nestin+GFAP− cells (c) or fibrous Nestin+GFAP+ cells (d) that feature multiple processes. (e) Quantitative analysis of the number of Nestin+ cells in the ROI of a hippocampus revealed that ES treatment increased the number of Nestin+ cells. (f) The phenotypic ratio of Nestin+ cells within a group. Nestin+ cells found in the hippocampus were mostly vessel‐like structural Nestin+GFAP− cell. Data are represented as mean ± SD. N = 4, 3, 6 animals with two tissue slices analyzed for untreated TBI, sham, ES; *p < 0.05, **p < 0.01, ***p < 0.001, ****p < 0.0001, Kruskal–Wallis one‐way ANOVA with Dunn's post hoc analysis in Figure e, and Two‐way ANOVA tests with Tukey's post hoc analysis in Figure f
