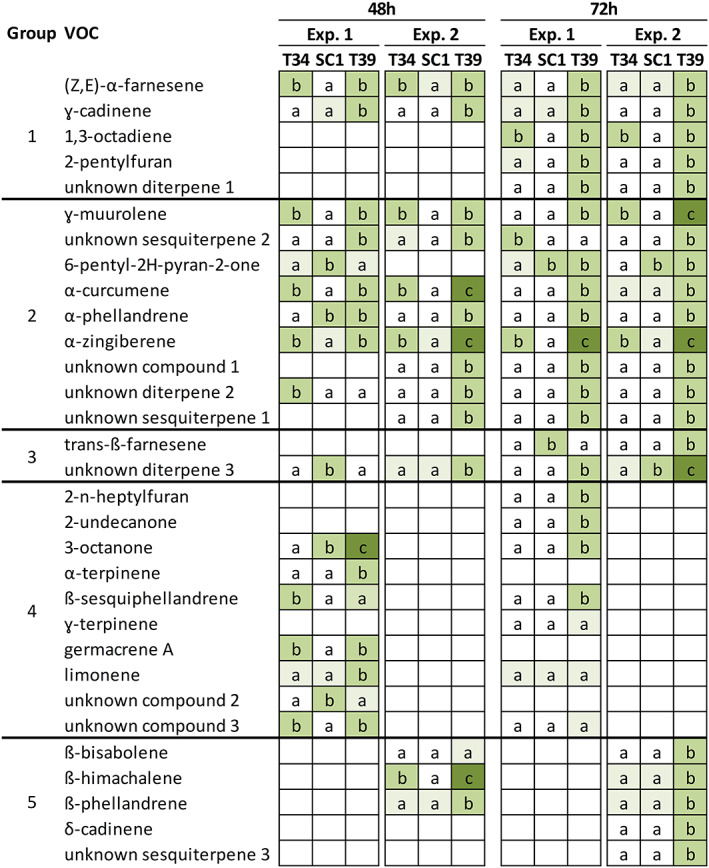
FIGURE 2.

Volatile organic compounds (VOCs) produced by Trichoderma strains. VOCs analysis was carried out using head space‐solid phase microextraction gas chromatography–mass spectrometry (HS‐SPME/GC‐MS) for T. asperellum T34 (T34), T. atroviride SC1 (SC1) and T. harzianum T39 (T39) grown for 48 h or 72 h on potato dextrose agar (PDA) in two independent experiments (Exp. 1 and Exp. 2). Different letters and color gradients indicate significant differences in VOC abundance among the Trichoderma strains for each experiment and time point, according to the Kruskal‐Wallis test (P ≤ 0.05) with a fold change higher than 1.5 (Tables S2 and S3). The letter ‘a’ was assigned to low VOC abundance (light green cell) or VOC abundance below the limit of detection (white cell). Five metabolite groups were identified according to changes in abundance among the three Trichoderma strains: Consistent changes in the two experiments at both time points (group 1) or at one time point (group 2); different changes in the two experiments (group 3); detection in the first (group 4) or in the second (group 5) experiment
