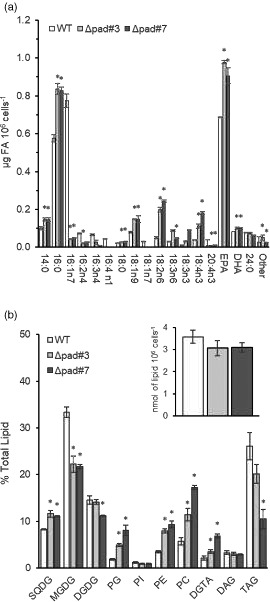
Figure 3.

Fatty acid (FA) and glycerolipid classes: comparison in the wild‐type (WT) and knockout strains during the exponential stage of growth phase (3 days).
(a) FA content. Values expressed in µg FA 106 cells−1. DHA, docosahexaenoic acid; EPA, eicosapentaenoic acid; PAD, palmitoyl‐acyl‐carrier protein Δ9‐desaturase.
(b) Glycerolipid classes. Values expressed in percentage of total lipids. Insert: quantitative analysis of total glycerolipids (nmol of lipid 106 cells−1). Growth stage was determined by analyzing cell density. Values presented are the average of three biological replicates, error bars represent SE. Asterisks indicate significant difference (P < 0.05, LSD) relative to WT. DAG, diacylglycerols; DGDG, digalactosyldiacylglycerol; DGTA, diacylglycerylhydroxymethyltrimethyl‐β‐alanine; MGDG, monogalactosyldiacylglycerol; PC, phosphatidylcholine; PE, phosphatidylethanolamine; PG, phosphatidylglycerol; PI, phosphatidylinositol; SQDG, sulfoquinovosyldiacylglycerol; TAG, triacylglycerols.
