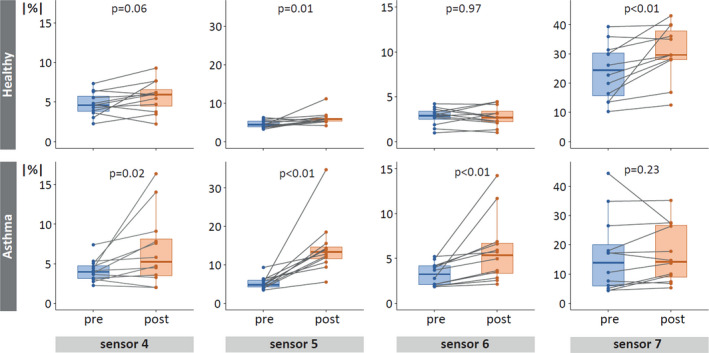
FIGURE 4.

Absolute eNose deviations pre‐ and post‐challenge. Absolute mean deviation percentages (|%|) of all healthy (top) and asthmatic (bottom) participants. Only sensors with significant differences (also after FDR adjustment) between the pre‐ (blue) and post‐challenge (orange) phase, for either one or both groups, are shown. Each dot represents the personal mean deviation pre‐ or post‐challenge, connected by a line, to visualize individual differences between the two study phases. Note that scales differ between sensors, but not between groups.
