Figure 4.

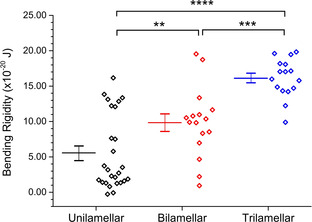
Bending rigidity of multilayered vesicles. Each data point corresponds to values obtained from distinct vesicles. Solid lines represent the mean. P values calculated using an unpaired t‐test (** p<0.01, *** p<0.001, **** p<0.0001).

Bending rigidity of multilayered vesicles. Each data point corresponds to values obtained from distinct vesicles. Solid lines represent the mean. P values calculated using an unpaired t‐test (** p<0.01, *** p<0.001, **** p<0.0001).