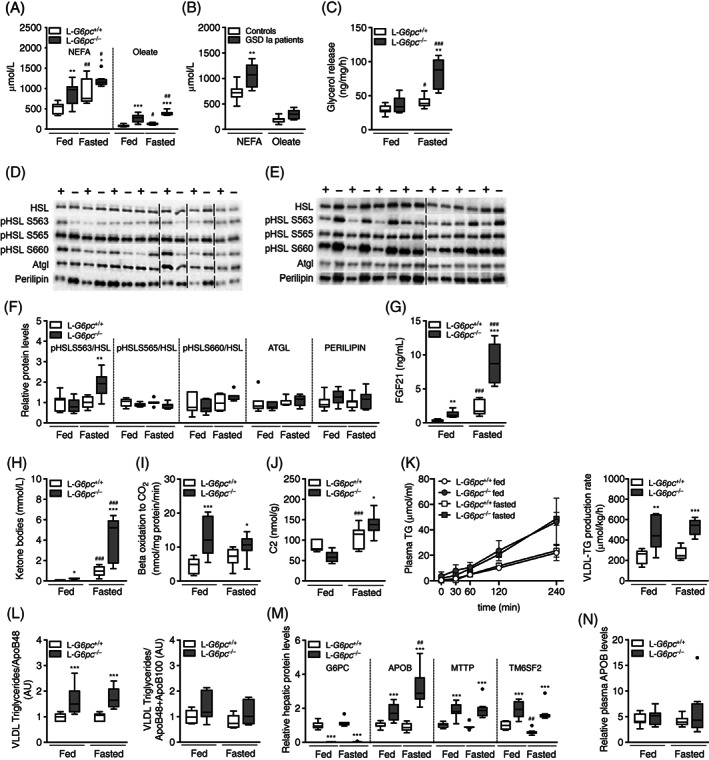
FIGURE 3.

Adipose tissue lipolysis is induced in fasted L‐G6pc −/− mice. Plasma levels of nonesterified fatty acids (NEFAs) and oleate in (A) L‐G6pc −/− mice and wild‐type littermates under fed and fasted conditions (n = 5‐8) and in (B) normoglycemic GSD Ia patients and age‐ and sex‐matched controls (n = 7). C, Ex vivo glycerol release from adipose tissue isolated from L‐G6pc −/− mice and wild‐type littermates under fed and fasted conditions (n = 6‐7). Representative Western blots from adipose tissue of (D) fed and (E) fasted L‐G6pc −/− mice (indicated by −) and wild‐type littermates (indicated by +) for indicated proteins (n = 7), with boundaries between different sodium dodecyl sulfate poly acrylamide gel electrophoresis (SDS‐PAGE) gels indicated by vertical dashed lines. F, Quantification of Western blots for phosphorylated HSL at different sites normalized to total HSL, and ATGL and PLIN (n = 7). Plasma levels of (G) FGF21 and (H) total ketone bodies in L‐G6pc −/− mice and wild‐type littermates under fed and fasted conditions (n = 5‐8). I, Ex vivo β‐oxidation capacity and (J) hepatic acylcarnitine C2 levels in L‐G6pc −/− mice and wild‐type littermates under fed and fasted conditions (n = 5‐8). K, very‐low‐density lipoprotein‐triglyceride (VLDL‐TG) production curves (left) and production rates (right); L, Ratios of TG/ApoB48 (left) and TG/ApoB48+ApoB100 (right) in isolated VLDL as assessed by Western blot analysis (for full blots, see Figure S2E). M, Hepatic and (N) plasma protein levels assessed by targeted proteomics in L‐G6pc −/− mice and wild‐type littermates under fed and fasted conditions (n = 6‐8), with APOB protein levels representing the sum of APOB48 and APOB100. ATGL, adipose triglyceride lipase; FGF21, fibroblast growth factor 21; GSD Ia, Glycogen Storage Disease type Ia; HSL, hormone sensitive lipase; PLIN, perilipin
