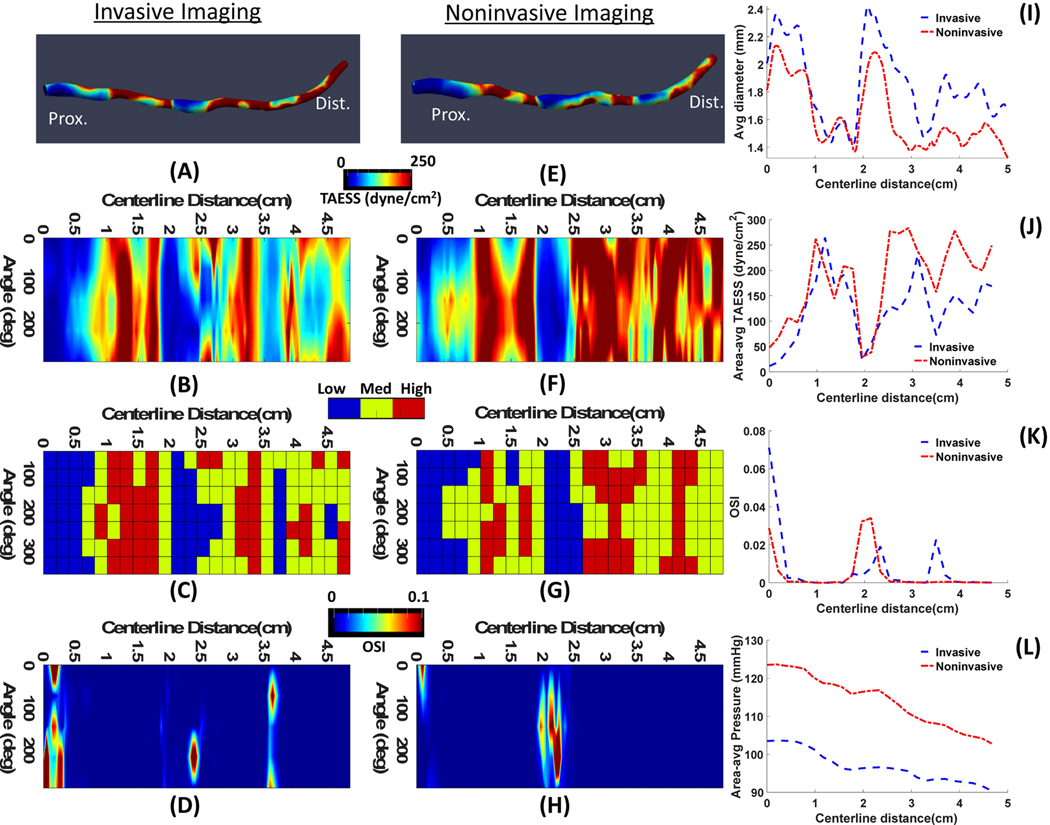
Figure 5.
A representative case (Patient 6) with moderate agreement between the hemodynamics calculation based on invasive OCT(A-D) and noninvasive CTA (E-H). 3D map of ESS representations (A,D) where the proximal and distal ends of the vessels are aligned with the 2D map of ESS (B,F) along the centerline of the vessel. Categorical values of ESS (C,G) show low, medium and high at each 45° arc and 2D map of OSI (D,H) values along the centerline are shown. Comparisons of average diameter (I), area averaged TAESS (J), area averaged OSI (K) and area-averaged pressure (L) show moderate agreement between IVUS and CTA calculated parameters.

