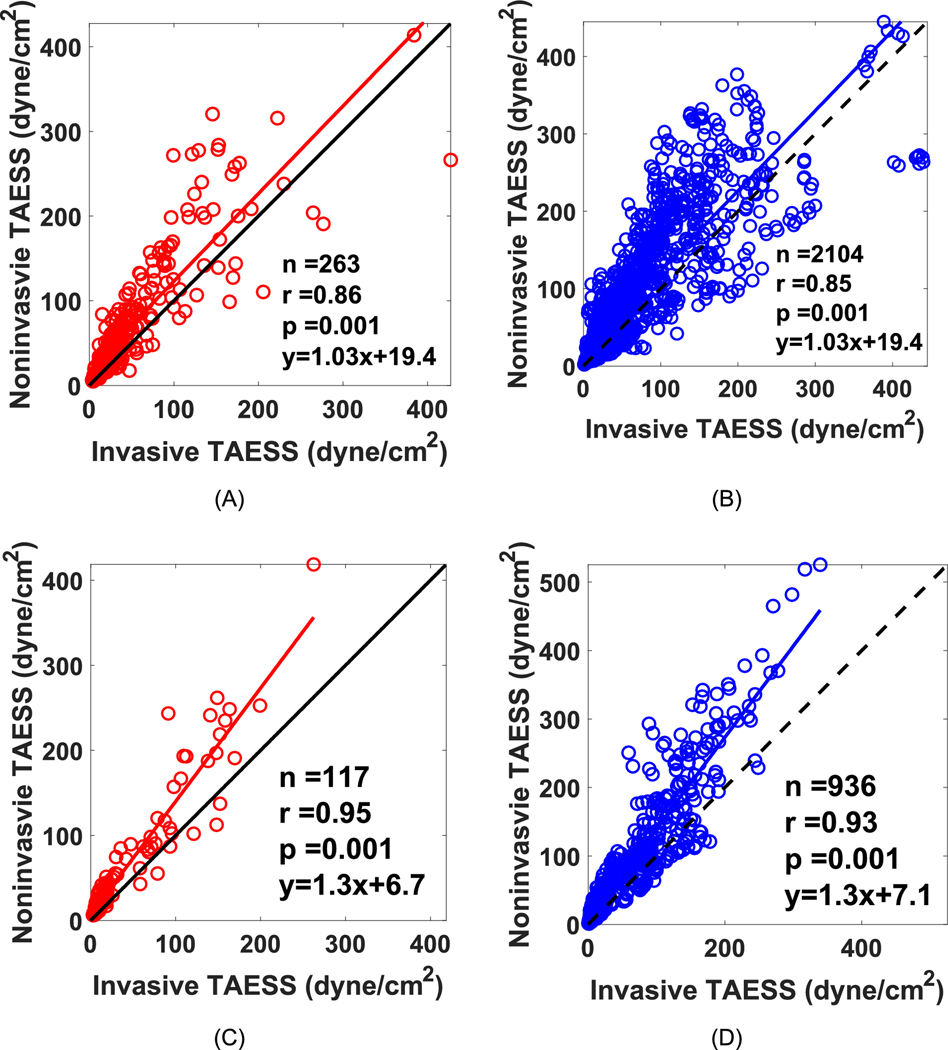
Figure 6.
Correlation plots between on TAESS calculations based on invasive and noninvasive imaging for the training dataset showing a high (A) Pearson correlation (r=0.86) for area-averaged TAESS and (B) r=0.85 for arc-averaged TAESS. The linear fit curve has a slope of 1.03 and a y-intercept of 19.4 showing a slightly higher TAESS values for the noninvasive imaging modality. The independent and testing patients show very high correlation between the invasive and noninvasive models for (C) area-averaged and (D) arc-averaged TAESS with a higher TAESS estimation in noninvasive TAESS.

