
Figure 3.
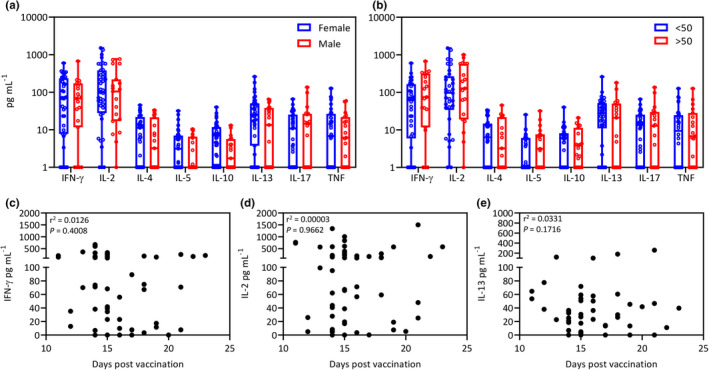
Impact of sex, age and days post‐vaccination on cytokine responses. (a) Box and whisker plots displaying post‐vaccination aggregate cytokine responses in females (n = 41) and males (n = 19). Data represent values after subtraction of background cytokine levels following incubation of blood with no antigen. Statistical significance was determined using multiple t‐tests. No significant differences were observed. (b) Box and whisker plots displaying post‐vaccination aggregate cytokine responses in participants < 50 years of age (n = 34) and > 50 years of age (n = 19). Data represent values after subtraction of background cytokine levels following incubation of blood with no antigen. Statistical significance was determined using multiple t‐tests. (c–e) No significant differences were observed. Data represent correlation of the production of IFN‐γ (c), IL‐2 (d) and IL‐13 (c) with days post‐vaccination. No significant correlations were observed.