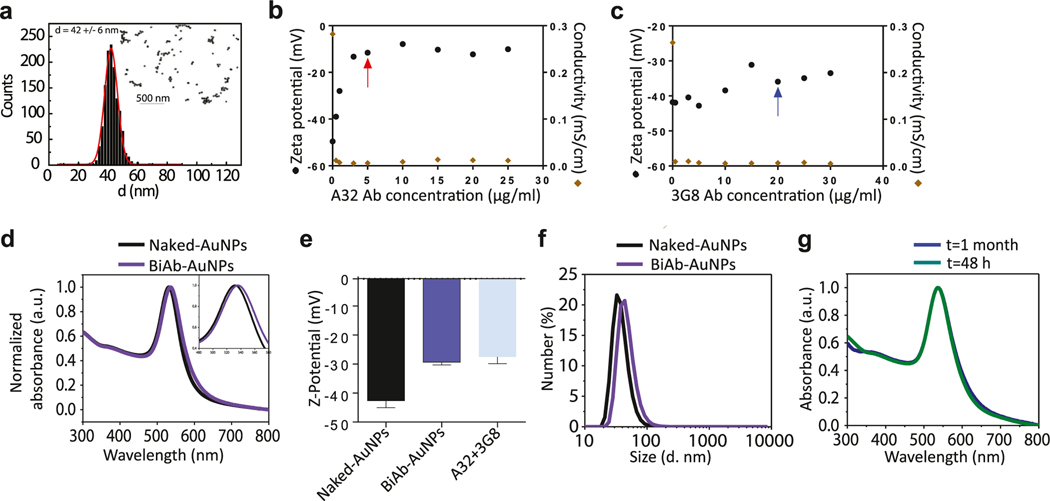
Fig. 1.
Characterization of the bispecific gold nanoparticles (BiAb-AuNPs). (a) Representative TEM image of the ~40 nm AuNPs. (b) A32-AuNPs saturation curve. Zeta potential (mV) versus the antibody concentration is plotted. The red arrow indicates the saturating concentration for the A32 antibody. (c) 3G8-AuNPs saturation curve. The blue arrow indicates the saturating concentration for the 3G8 antibody. (d) Representative UV-Vis spectra of the BiAb-AuNPs compared to naked AuNPs. (e) Z-potential measurements of BiAb-AuNPs, naked AuNPs, and the single antibodies A32 and 3G8 (n = 3, mean with SD). (f) Representative Dynamic light scattering (DLS) characterization of the BiAb-AuNPs compared to naked nanoparticles. (g) Representative UV-Vis spectra of the BiAb-AuNPs at 48 h and 1 month after antibody conjugation.

