Fig. 3.
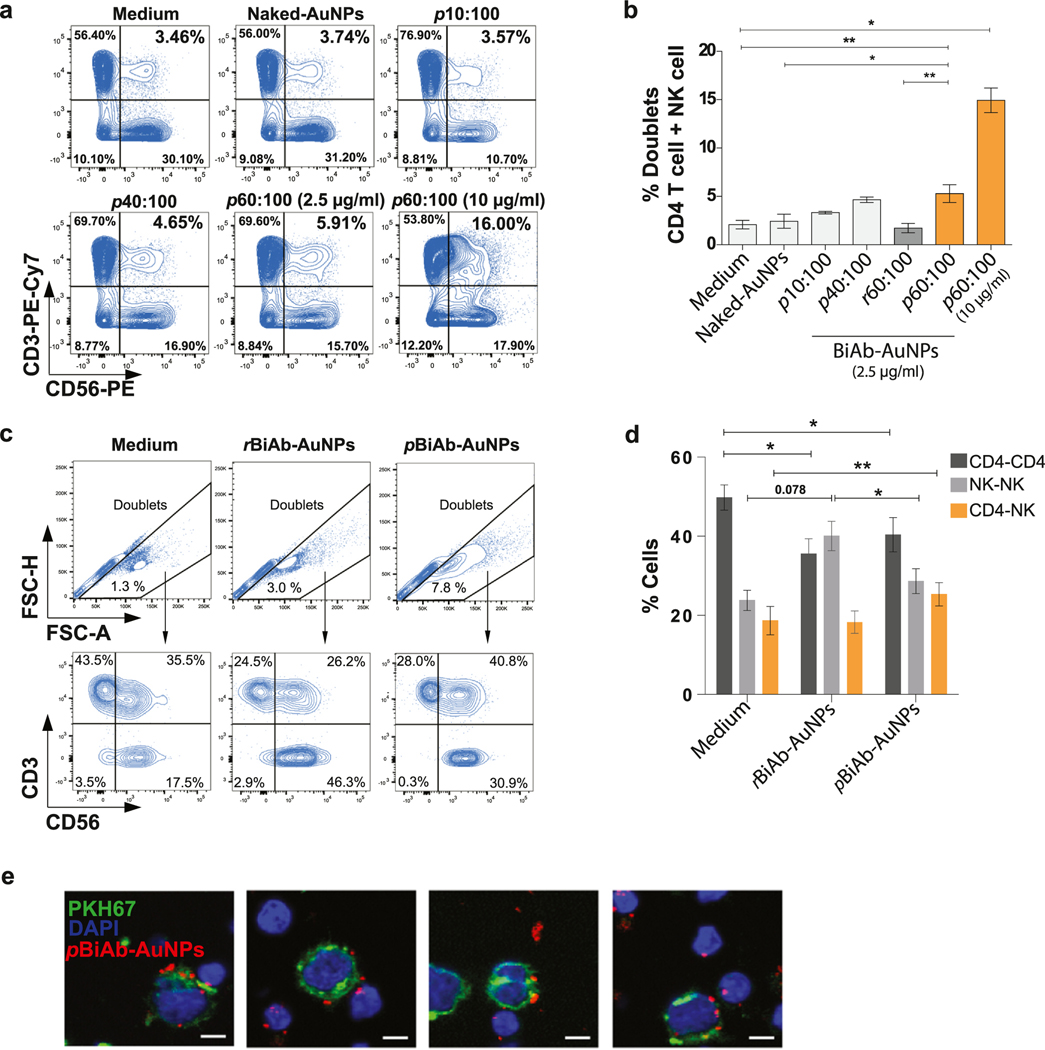
The pBiAb-AuNPs induce cell-to-cell contact between HIV-expressing cells and NK cells. (a) Representative flow cytometry plots showing cell doublets corresponding to primary CD4+ T cells coated with gp120 (CD3+) and primary NK cells (CD56+) after 20 min co-culture in the presence of the different nanoconjugates. Double positive cells for the markers CD3 and CD56 denote pairs of cells formed by CD4-HIV+ and NK cells. Controls corresponding to medium alone and non-conjugated (naked) nanoparticles are shown. Different ratios for the generation of BiAb-AuNPs and different total antibody concentrations on the nanoparticles (2.5 μg/ml for all conjugates and an additional dose of 10 μg/ml for 60:100 ratio) are shown. (b) Summary graph for the induction of cell-to-cell contacts in the presence of different nanoconjugates. Mean with SEM for the experimental replicates are shown. Statistical analysis consisted on a paired t-test. *p < 0.05. (c) Representative example of the gating strategy to identify cell doublets using the FSC-H and FSH-A signals, and the subsequent analysis of the frequency of different types of cell pairs using the cell markers CD3 and CD56. (d) Distribution of the cell doublets. Cell doublets were identified by flow cytometry using the FSH-H and FSH-A plot. The total cell doublets were distributed in T-T cells (CD3+CD3+), NK-NK (CD56+CD56+) or T-NK (CD3+CD56+) doublets and the percentages are plotted. Data shows mean with SEM of n = 6 independent experiments. Statistical comparisons were performed using Wilcoxon matched-pairs signed rank test. (e) Representative confocal micrographs of HIV-expressing cells (CEM.NKR CCR5+ coated with HIV gp120 recombinant protein and stained with PKH67 in green, and DAPI nuclei staining in blue) and primary NK cells (DAPI nuclei staining). Both cell types were co-cultured at 1:1 ratio for 20 min in the presence of the pBiAb-AuNPs. pBiAb-AuNPs are visualized in red. Scale bar represents 5 μm.

