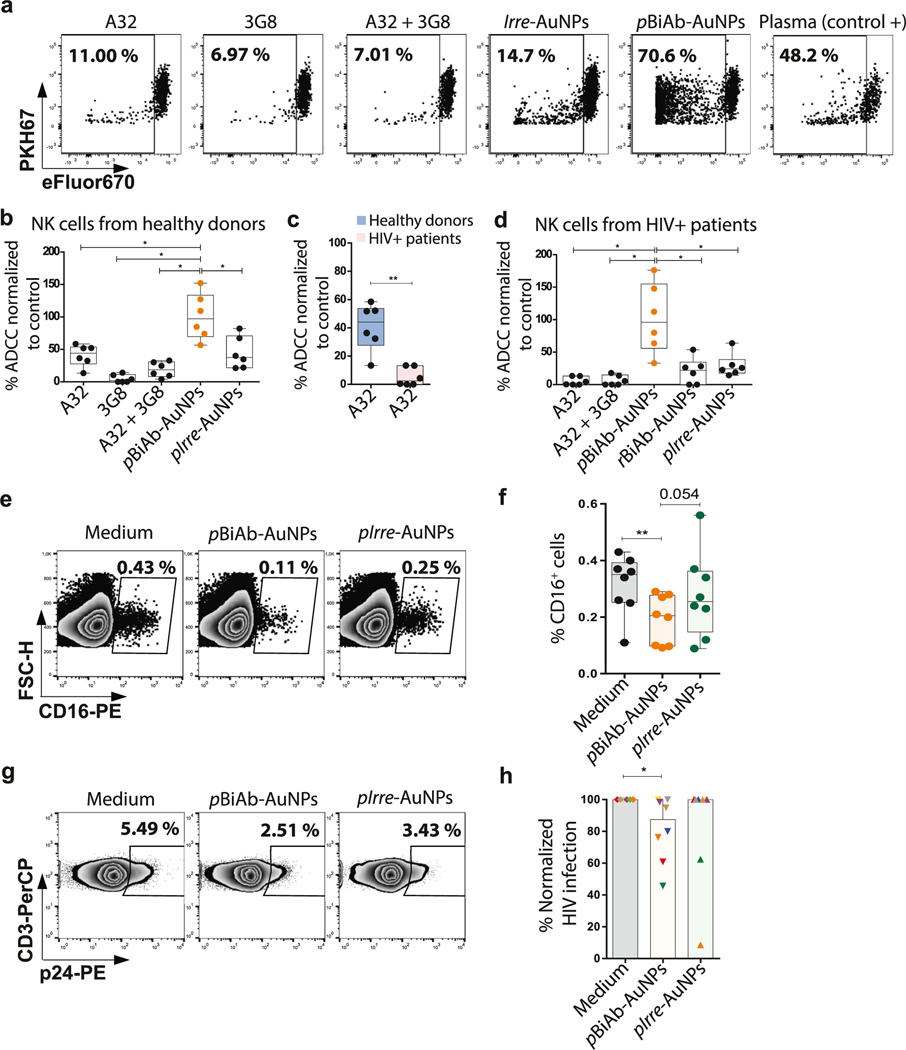
Fig. 4.
NK-mediated cytotoxic response against HIV-expressing cells promoted by the pBiAb-AuNPs. (a) Representative flow cytometry plots for NK-mediated cytotoxicity assays. CEM-NKR.CCR5+ cells were double-stained with PKH67 and eF670, and coated with the HIVBal gp120 recombinant protein. Cells were co-cultured with primary NK for 4 h at 1:10 target/effector ratio and in the presence of different nanoconjugates at the following antibody doses: 10 μg/ml for pIrre-AuNPs, 10 μg/ml for pBiAb-AuNPs and 5 μg/ml for each free antibody. Loss of the eF670 marker was used to determine the percentage of dead cells in an eF670 versus PKH67 plot. (b) Summary graph (n = 6) of the ADCC activity mediated by NK cells from healthy donors in the presence of different nanoconjugates at the following antibody doses: 10 μg/ml for irrelevant AuNPs, 10 μg/ml for pBiAb-AuNPs and 5 μg/ml for each free antibody. Represented data is normalized to the positive control condition (plasma from a viremic HIV+ patient). Statistical comparisons were performed using Wilcoxon matched-pairs signed rank test. Median with range (min-max) are shown. *p < 0.05. (c) Graph comparing the ADCC NK-mediated response between healthy donors and treated HIV-infected patients in the presence of the anti-gp120 antibody A32. Statistical comparisons were performed using Mann-Whitney test. Median with range (min-max) are shown. *p < 0.05; **p < 0.01. (d) Summary graph (n = 6) of the ADCC activity mediated by NK cells from treated HIV-infected patients in the presence of different nanoconjugates at the following antibody doses: 10 μg/ml for irrelevant AuNPs, 10 μg/ml for pBiAb-AuNPs and non-polarized rBiAb-AuNPs, and 5 μg/ml for each free antibody. Represented data is normalized to the positive control condition (plasma from a viremic HIV+ patient). Statistical comparisons were performed using Wilcoxon matched-pairs signed rank test. Median with range (min-max) are shown. *p < 0.05. (e) Representative flow cytometry plots showing CD16-expressing cells in digested cells after 24 h of tonsil histoculture in the presence of the pBiAb-AuNPs or Irre-AuNPs (5 μg/ml of antibody burden dose). (f) Summary graph showing CD16-expressing cells after different tissue culture conditions (basal condition, 24 h incubation with 5 μl of pBiAb-AuNPs at 5 μg/ml dose or 5 μl of Irre-AuNPs at 5 μg/ml dose per block) in n = 8 histocultures. Median and ranges (min-max) are shown. Statistical comparisons were performed using Wilcoxon matched-pairs one tailed signed rank test. *p < 0.05; **p < 0.01. (g) Representative flow cytometry plots showing reduction in HIV infection (by detection of the viral protein p24) after 6 days of infection of the tonsil histocultures, in the presence of the pBiAb-AuNPs or Irre-AuNPs (5 μl of the 5 μg/ml dose per tonsil block). (h) Graph summarizing the results of the HIV inhibition assays (measured at day 6 of HIV infection by detecting the p24 antigen expression by flow cytometry) in tonsil histocultures in the presence of the pBiAb-AuNPs or Irre-AuNPs (5 μl of the 5 μg/ml dose per tonsil block) (n = 8). Median with ranges are represented. Statistical comparisons were performed using Wilcoxon matched-pairs signed rank test. *p < 0.05.

